

Queens College
|
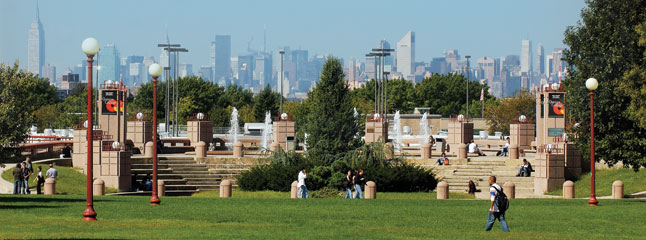
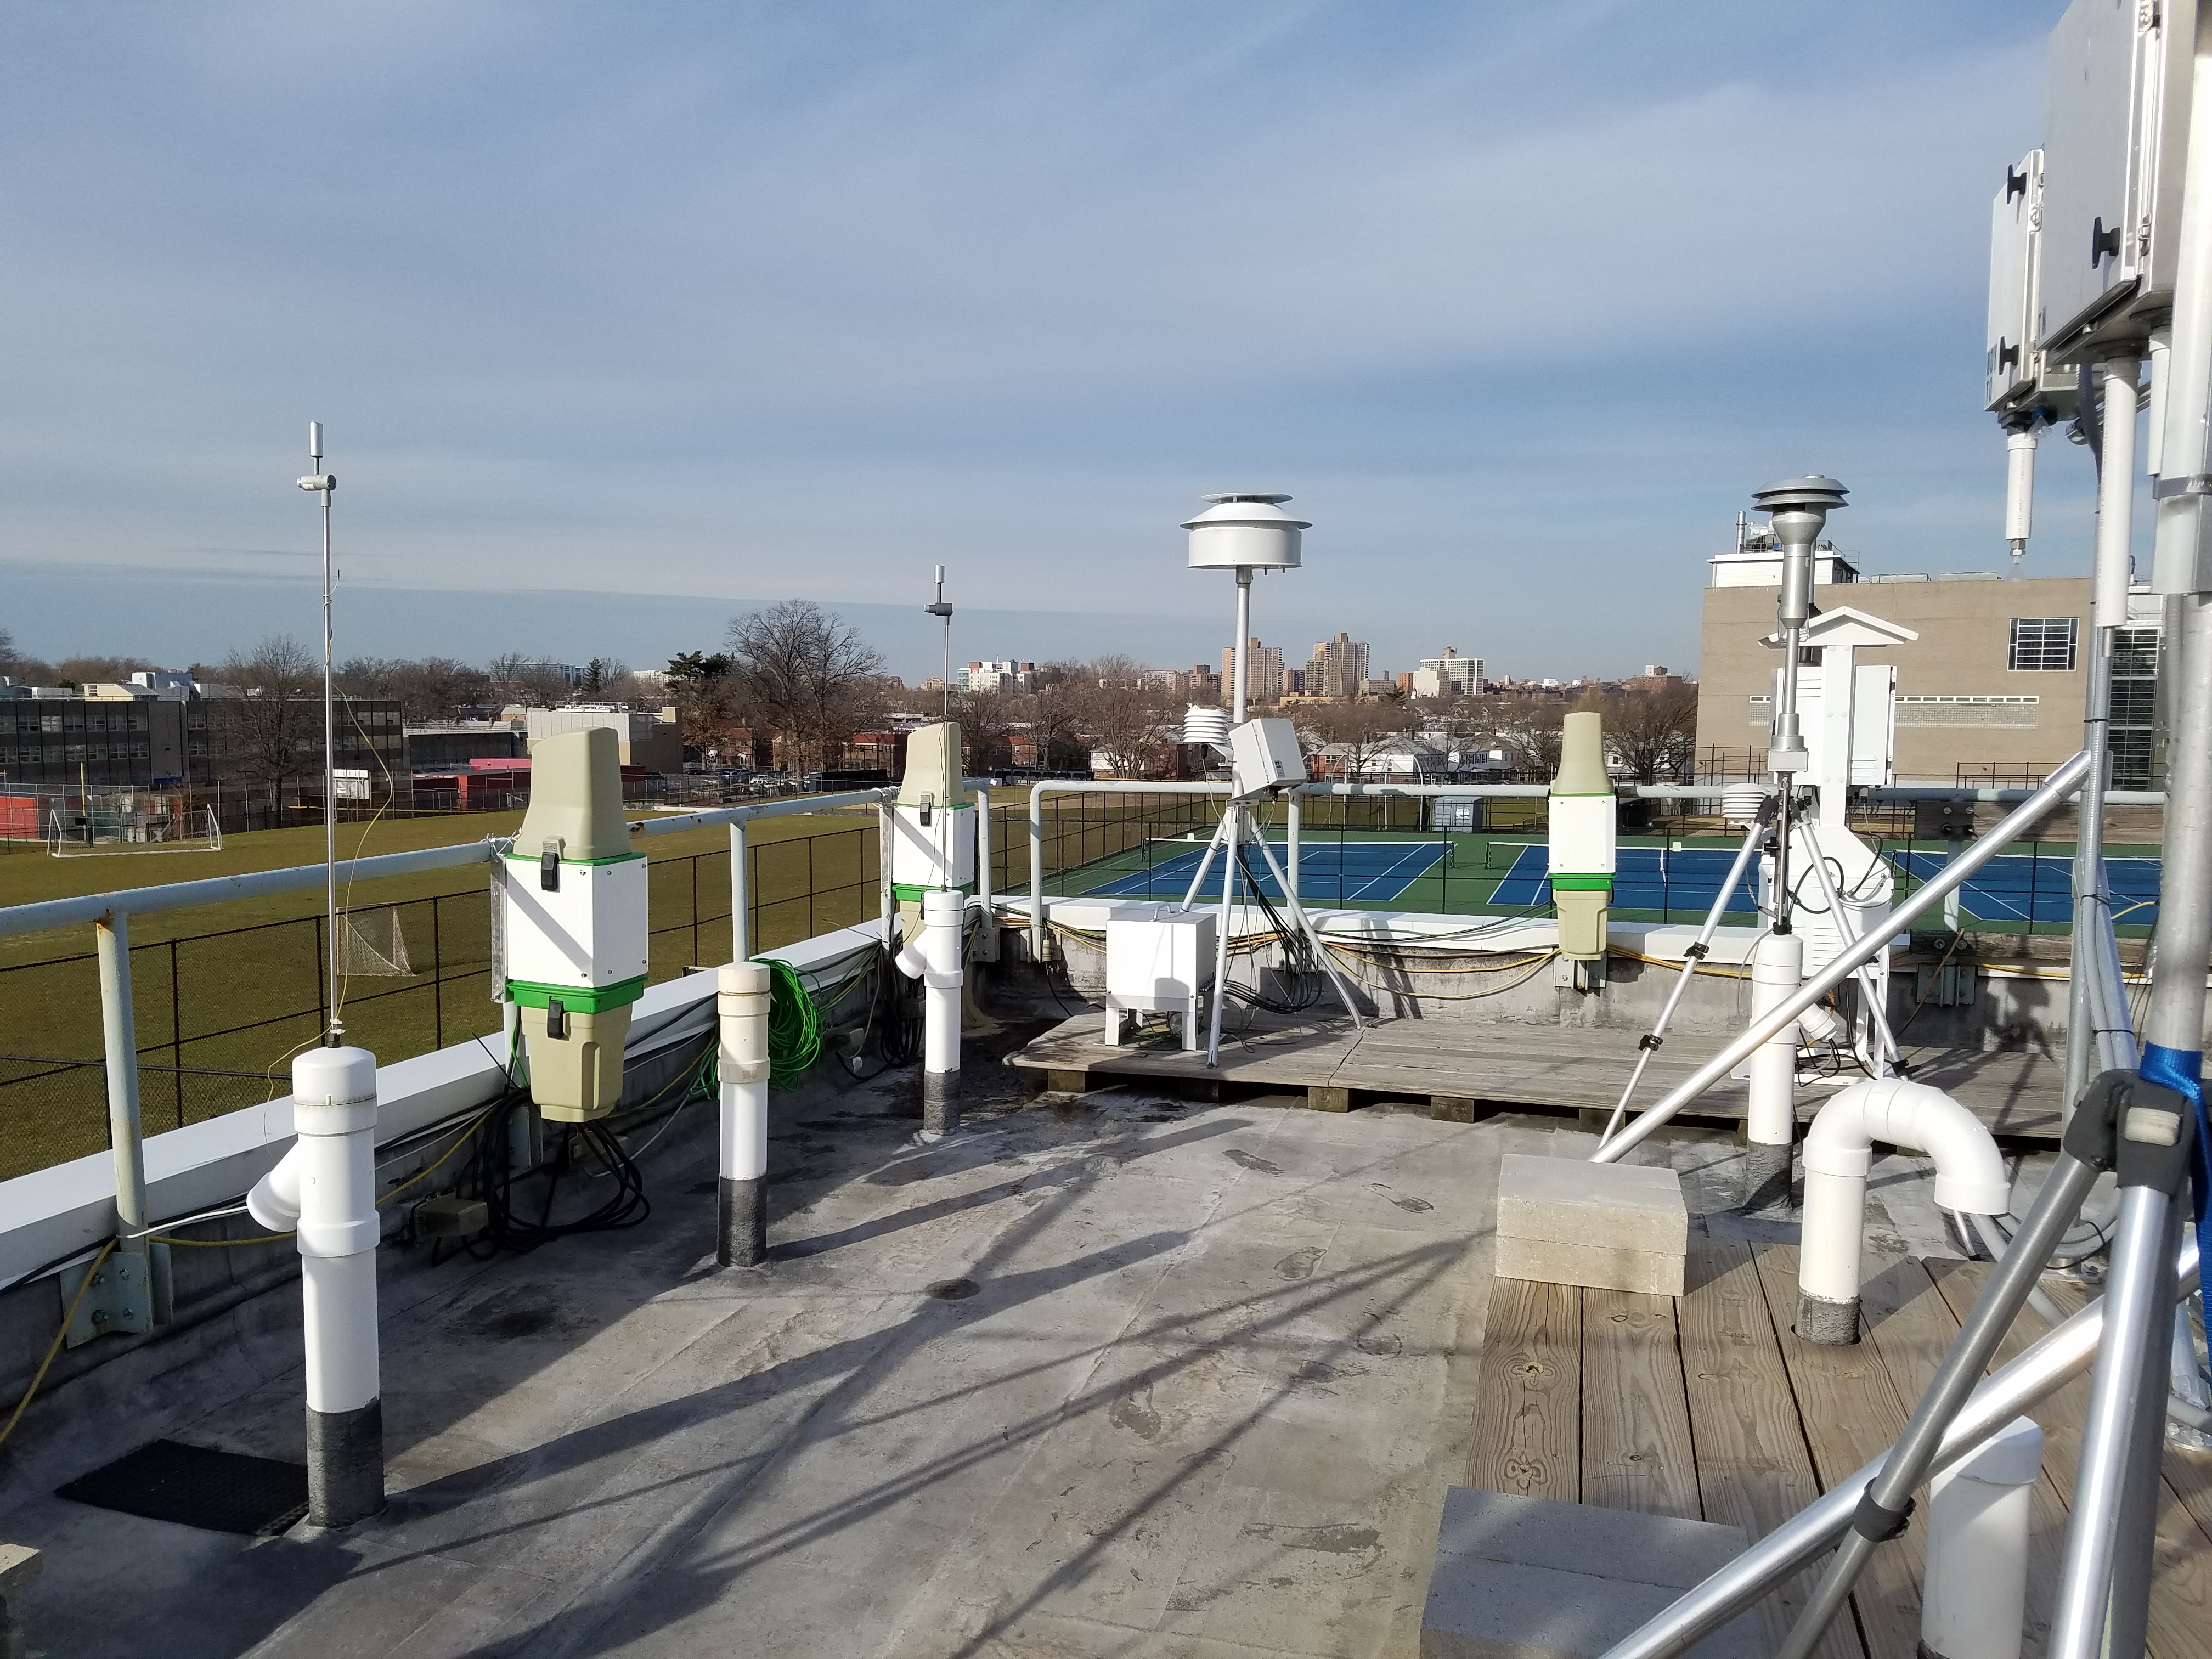
CH Technologies (USA) Inc. is monitoring nanoparticles at Queens College, an air quality monitoring site operated by the New York State Department of Conservation in Queens, New York. Similar to the Fort Lee Public Library, this location was chosen as it is in a high traffic area - ten miles east of Manhattan. One Pegasor AQIndoor and three AQUrban units were installed at the Queens College monitoring station. These instruments were co-located with devices the NYSDEC is using for continuous ambient monitoring, e.g. TEOM, SMPS, and CPC. PM2.5 and Particle Concentration data from the devices are also available to supplement the Pegasor measurements. Envirologger reports the collected data as a part of the total air quality monitoring network. One example of this with reference and test instrumentation can be found at the following location - AQ MESH Demo - for Stratford-upon-Avon, UK. The data obtained through the devices as well as its respective location in Google Maps can be seen below. Also a guest login for additional data and graphs of the site is available upon request. Simply email sales@chtechusa.com for the login information. The two figures pictured on the left show the campus at Queens College (top), and the 3 Pegasor Urban units at the monitoring station (bottom). |
|
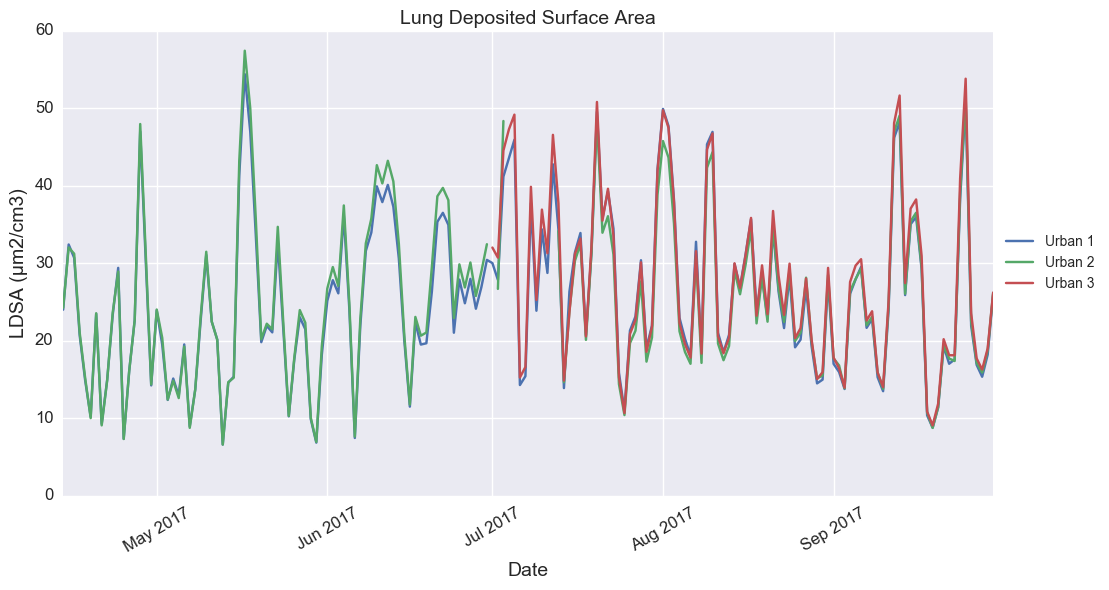
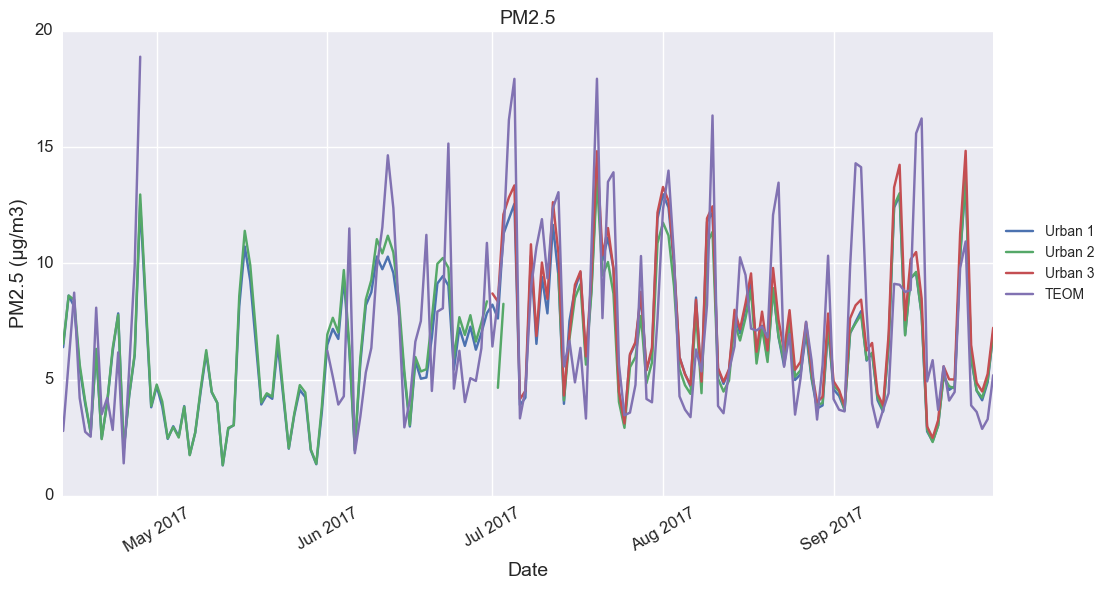
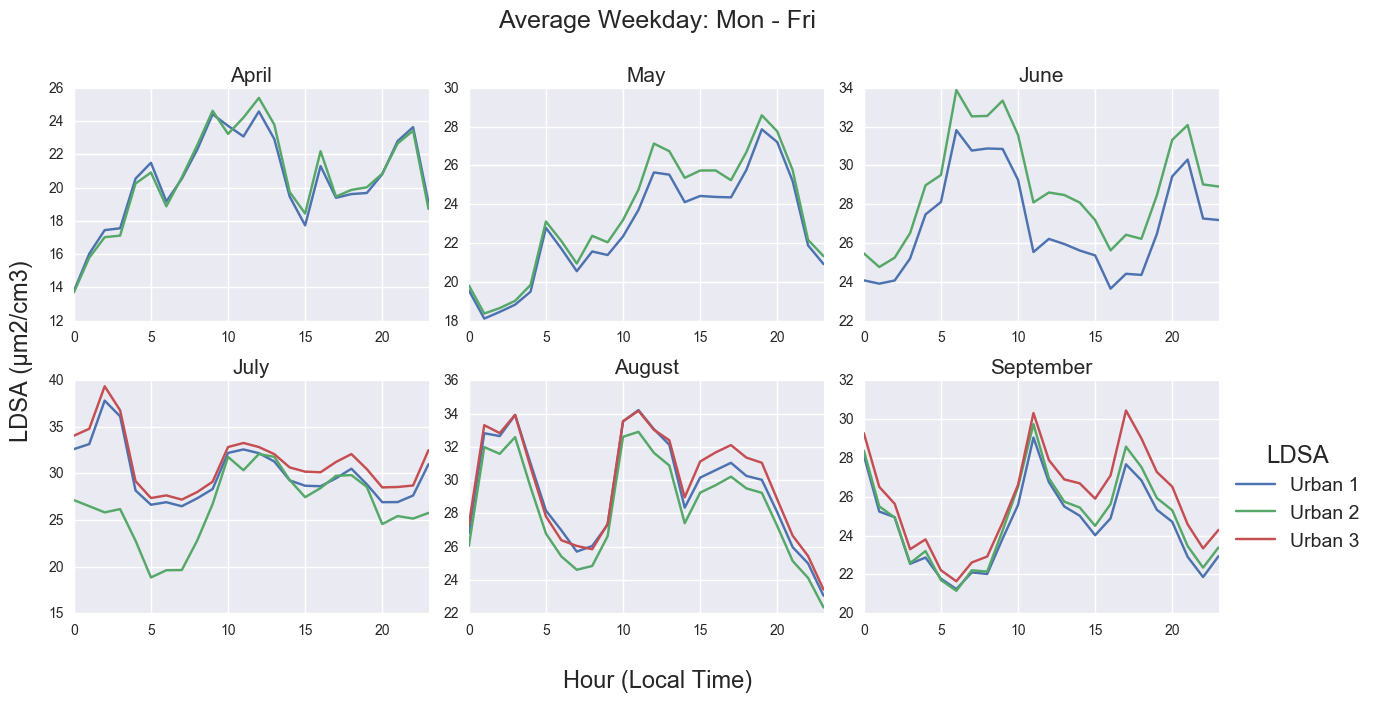
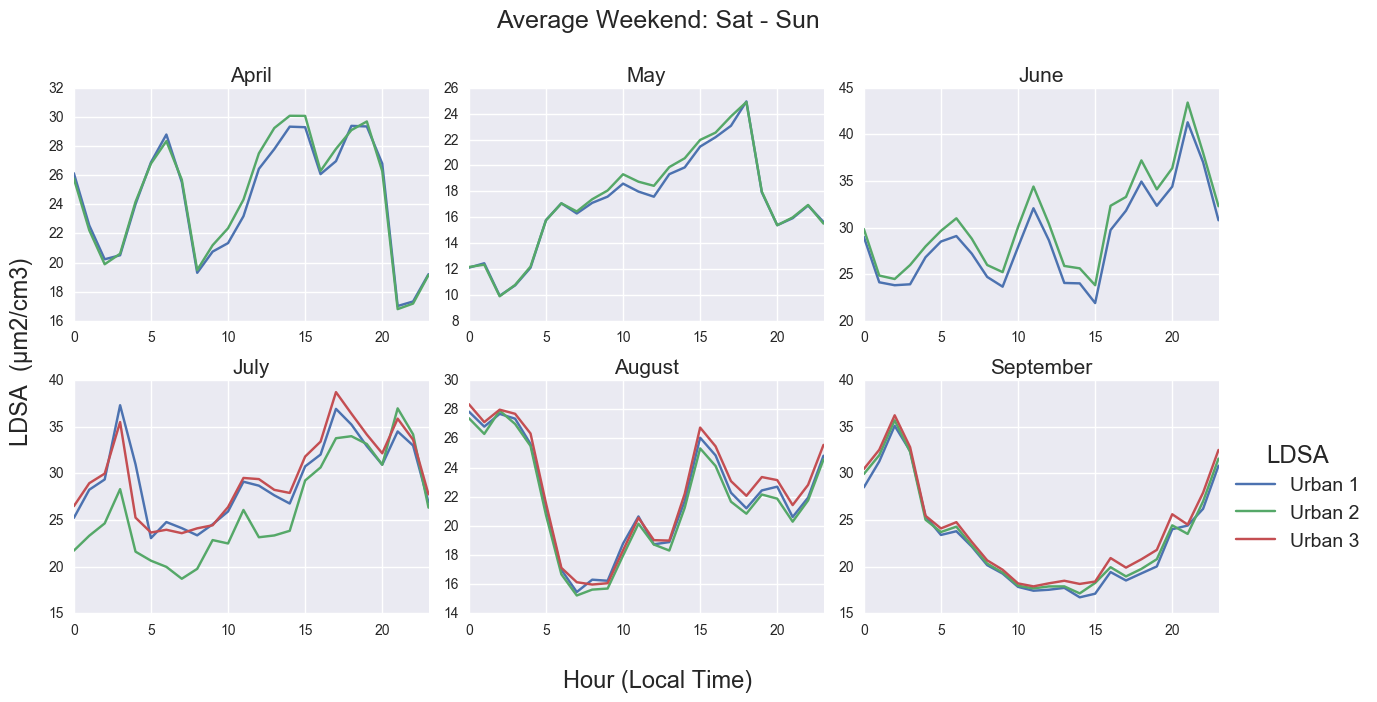
Daily averages from 14 April to 30 September are plotted for Lung Deposited Surface Area, PM2.5, and Particle Concentration. All three metrics are monitored by the three Pegasor AQ Urban units, PM2.5 data are measured by the Thermo Scientific 1405 TEOM, and the Particle Concentration data are collected by TSI's Ultrafine Particle Monitor (SMPS) 3031 and Environmental Particle Counter 3783.
|
|
A guest login for additional data and graphs is available upon request. |