
1-201-666-2335 X 1

Fort Lee Library

|
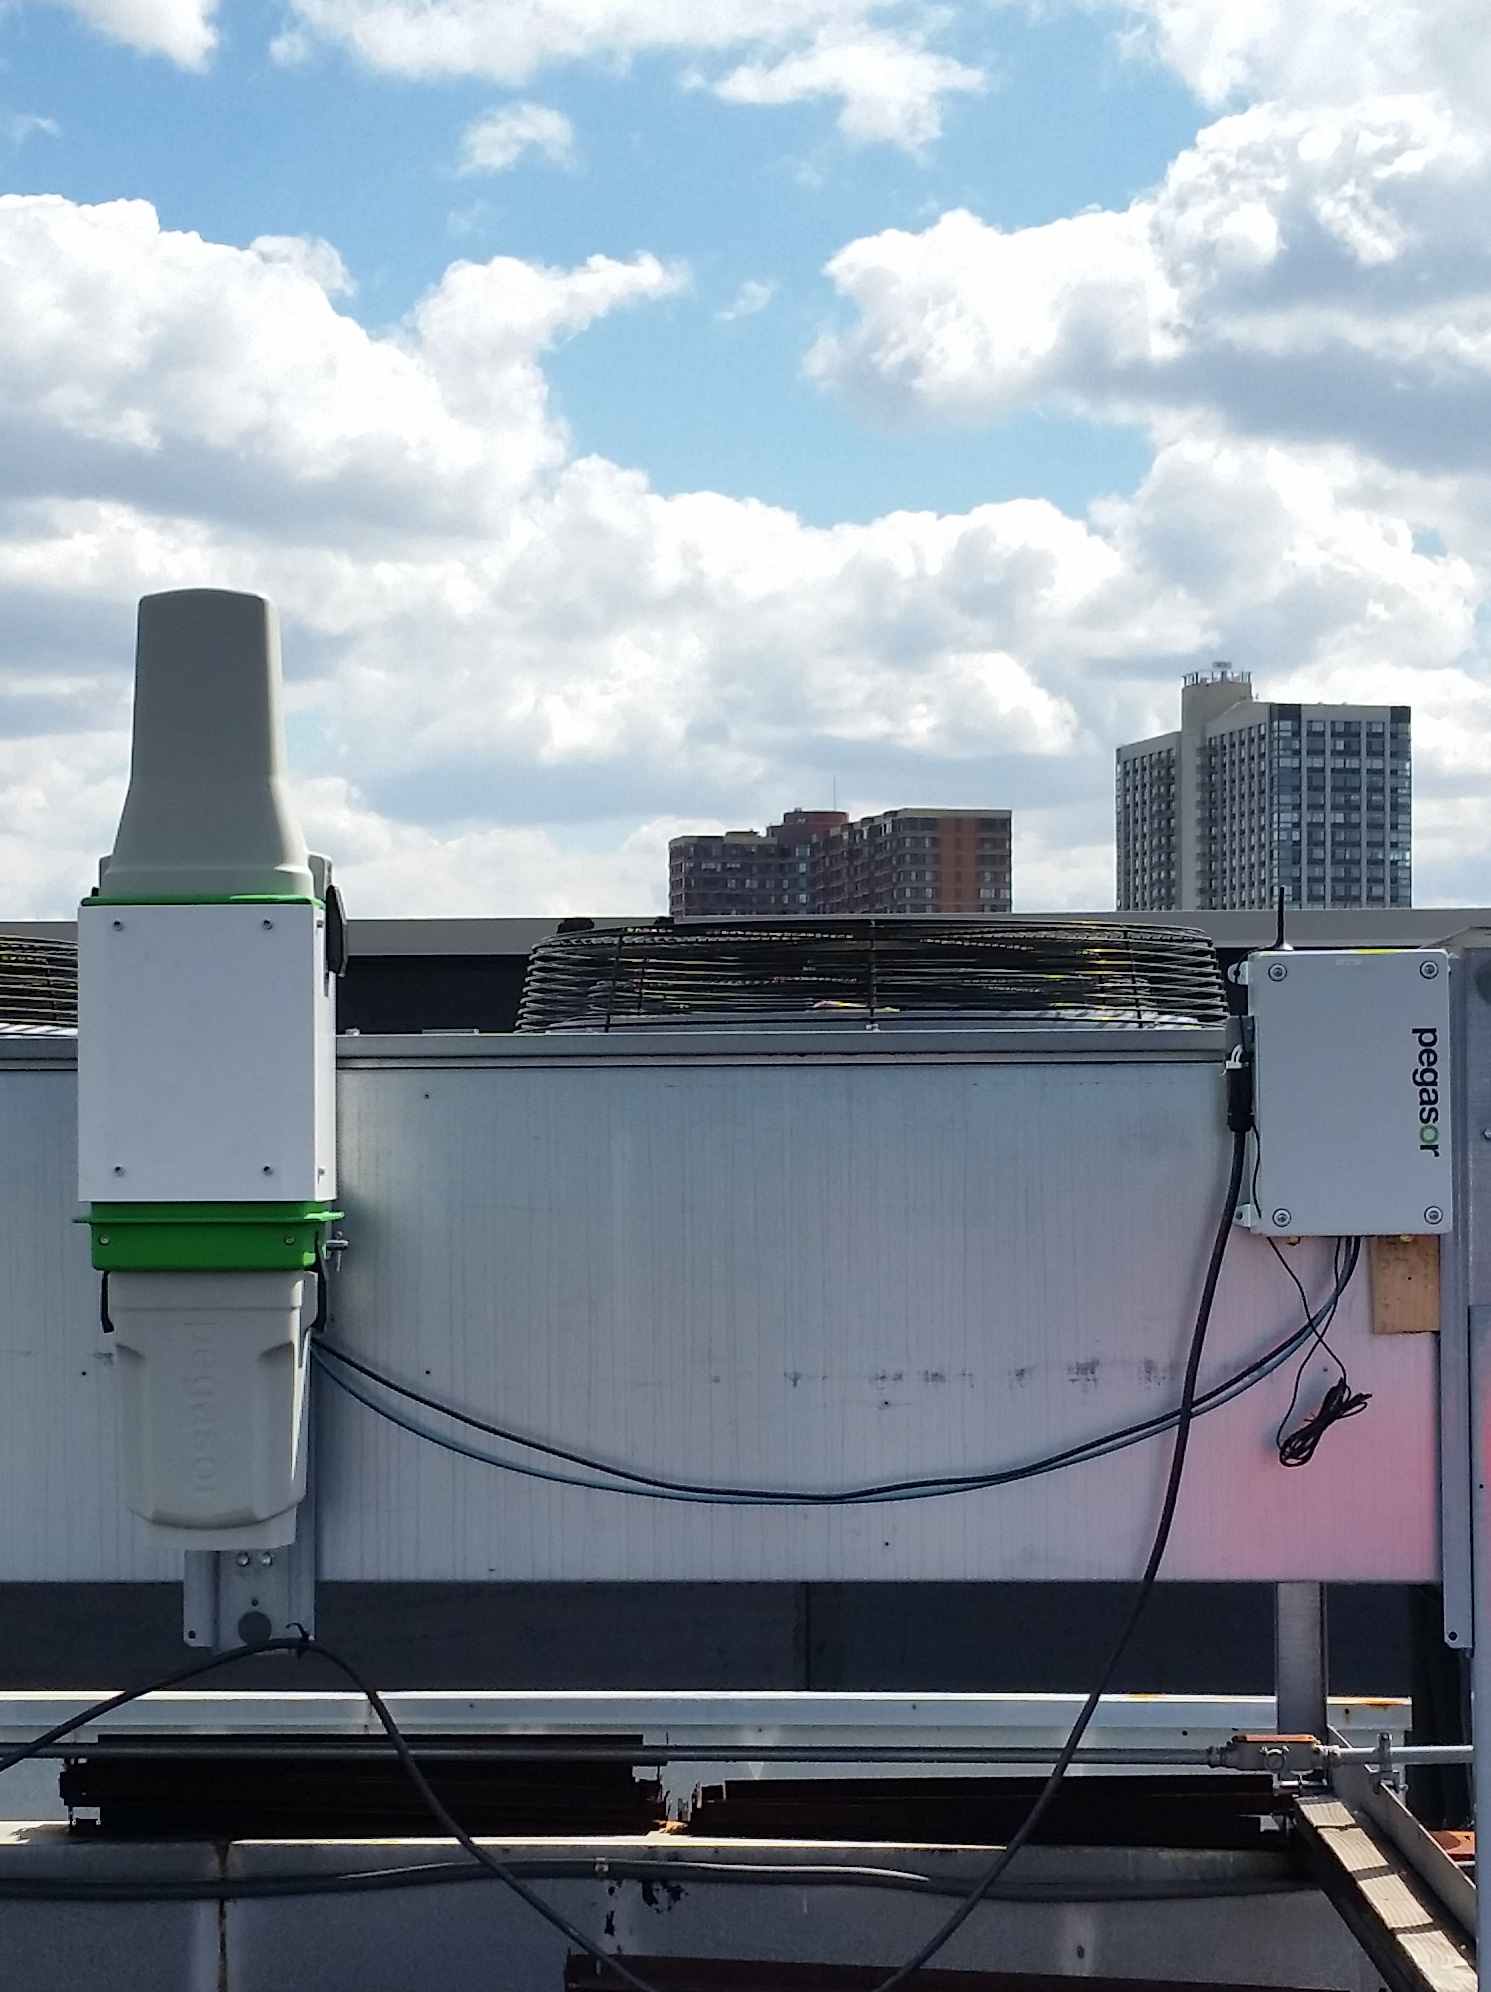
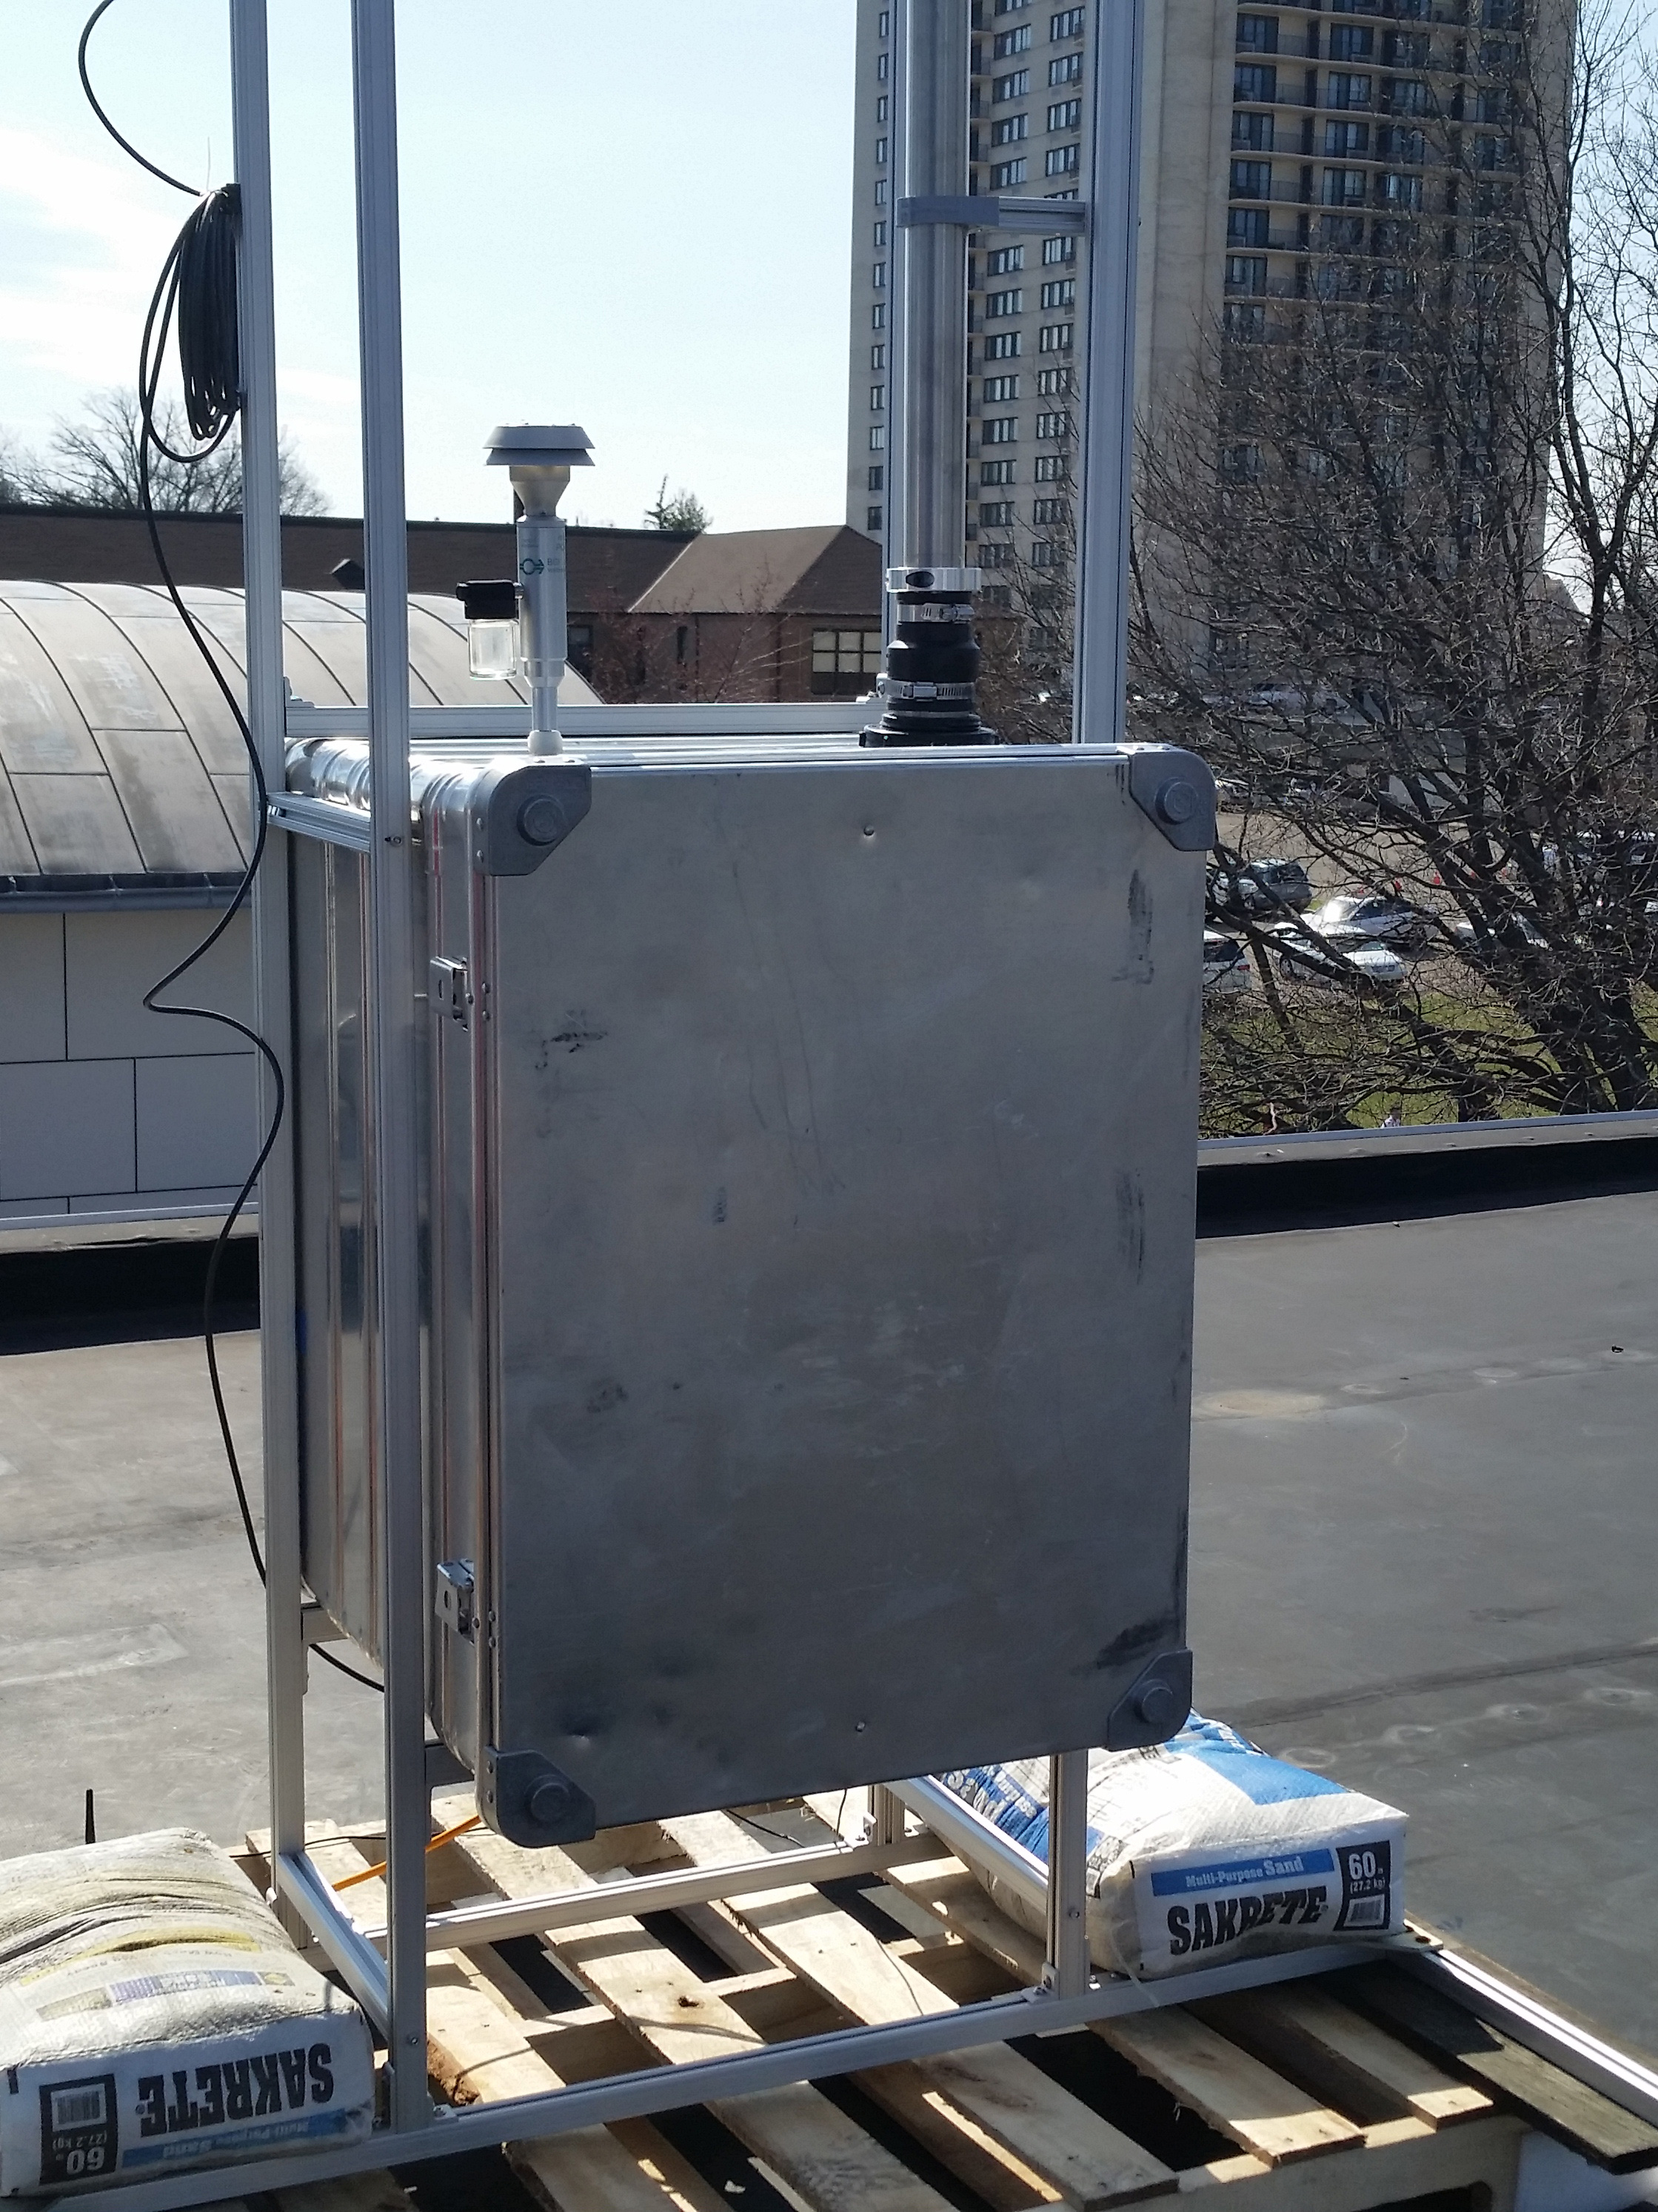
CH Technologies (USA) Inc. announces that a new research project is being undertaken to assess the air quality on the roof of the Public Library in Fort Lee, New Jersey. The Fort Lee Library is within close proximity to the George Washington Bridge which is expected to be a high source of emissions from automotive exhausts. We are implementing the relocation of CH Technologies’ continuous environmental monitoring station from its previous location at the Rutger's Photochemical Assessment Monitoring (PAM) site to the Fort Lee Library. Air quality is being monitored through the use of CH Technologies' air quality monitoring station as well as the Pegasor AQ Urban monitoring device. The devices are colocated with a Federal Reference Method (FRM) monitoring station that utilizes gravimetric sampling to determine air quality. The CH Technologies monitoring station consists of a weather tight cabinet, meteorological sensors, an optical particle counter, an electrometer, and a data logger.
Envirologger then reports the collected data as a part of the total air quality monitoring network. One example of this with reference and test instrumentation can be found at the following location - AQ MESH Demo. The data obtained through the devices as well as its respective location in Google Maps can be seen below. Also a guest login for additional data and graphs of the site is available upon request. Simply email carlucciodj@chtechusa.com for the login information. |
|
*The NAAQS standards for the PM 2.5 and the AQI limits for the PM 10 suggested by the EPA can be made viewable through the use of the pull down tabs by selecting the "PM 2.5" or "PM 10" for the pollutant and the"yes" option for the index. The AQI values provide an easy interpretation of the daily air quality where as the NAAQS values are only relevant if the correct averaging time is available and selected. |
|
A guest login for additional data and graphs is available upon request. |