
1-201-666-2335 X 1

Fort Lee Public Library
 |
CH Technologies (USA) Inc. assessed the indoor and outdoor air quality at the Fort Lee Public Library in Fort Lee, NJ. The library is about a mile away from the George Washington Bridge, which is expected to be a source of high emissions from automotive exhausts. The continuous environmental monitoring station from the Rutger's Photochemical Assessment Monitoring (PAM) site was relocated to the library. This monitoring station included a weather tight cabinet, meteorological sensors, an optical particle counter, an electrometer, and a data logger:
A Pegasor AQUrban was also co-located on the roof with a Federal Reference Method (FRM), which is a gravimetric sampler. A Pegasor AQ Indoor measured UFP concentrations inside the Children's Reading Room of the library to determine the influence of traffic on the environment inside. |
|
MOTIVATION Ultrafine particles (UFPs) have been shown to be associated with adverse health effects--e.g. cardiovascular disease, asthma, lung cancer, fatigue, and most recently, dementia [1]. This particle range is a mixed class of substances that, while ill-defined, are not routinely monitored or regulated. Further, while ambient particulate concentrations may translate to outdoor exposure, people spend about 90% of their time indoors where additional sources may exist. As such, this study aims to quantify the indoor/outdoor (I/O) ratio [2] of UFPs in densely populated and high traffic areas [3]. Studies suggest smaller particles are more biologically active due to surface area. Thus, we focus on Lung Deposited Surface Area (LDSA), which is the fraction of the particle size distribution by surface area that is expected to deposit in the alveolar region of the lung. METHOD Two Pegasor AQUrban and one AQ Indoor devices were placed around New Jersey at: the Fort Lee Public Library, and the George Washington Bridge toll plaza (fig. 1). These devices were co-located with Gravimetric Samplers (Federal Reference Method), a Naneos Partector, and a Palas Fidas 200 (EU and UK recognized monitor). The Naneos Partector is a handheld nanoparticle measuring devices that uses the same passive charging technique to measure LDSA and has a similar size range of detection. The Fidas 200 is an Optical Particle Spectrometer that measures total suspended particulates. Particle Number concentration, and size fractions PM10, PM4, PM2.5, and PM1 simultaneously. The NJDEP operates the co-located FRM environmental monitoring device. 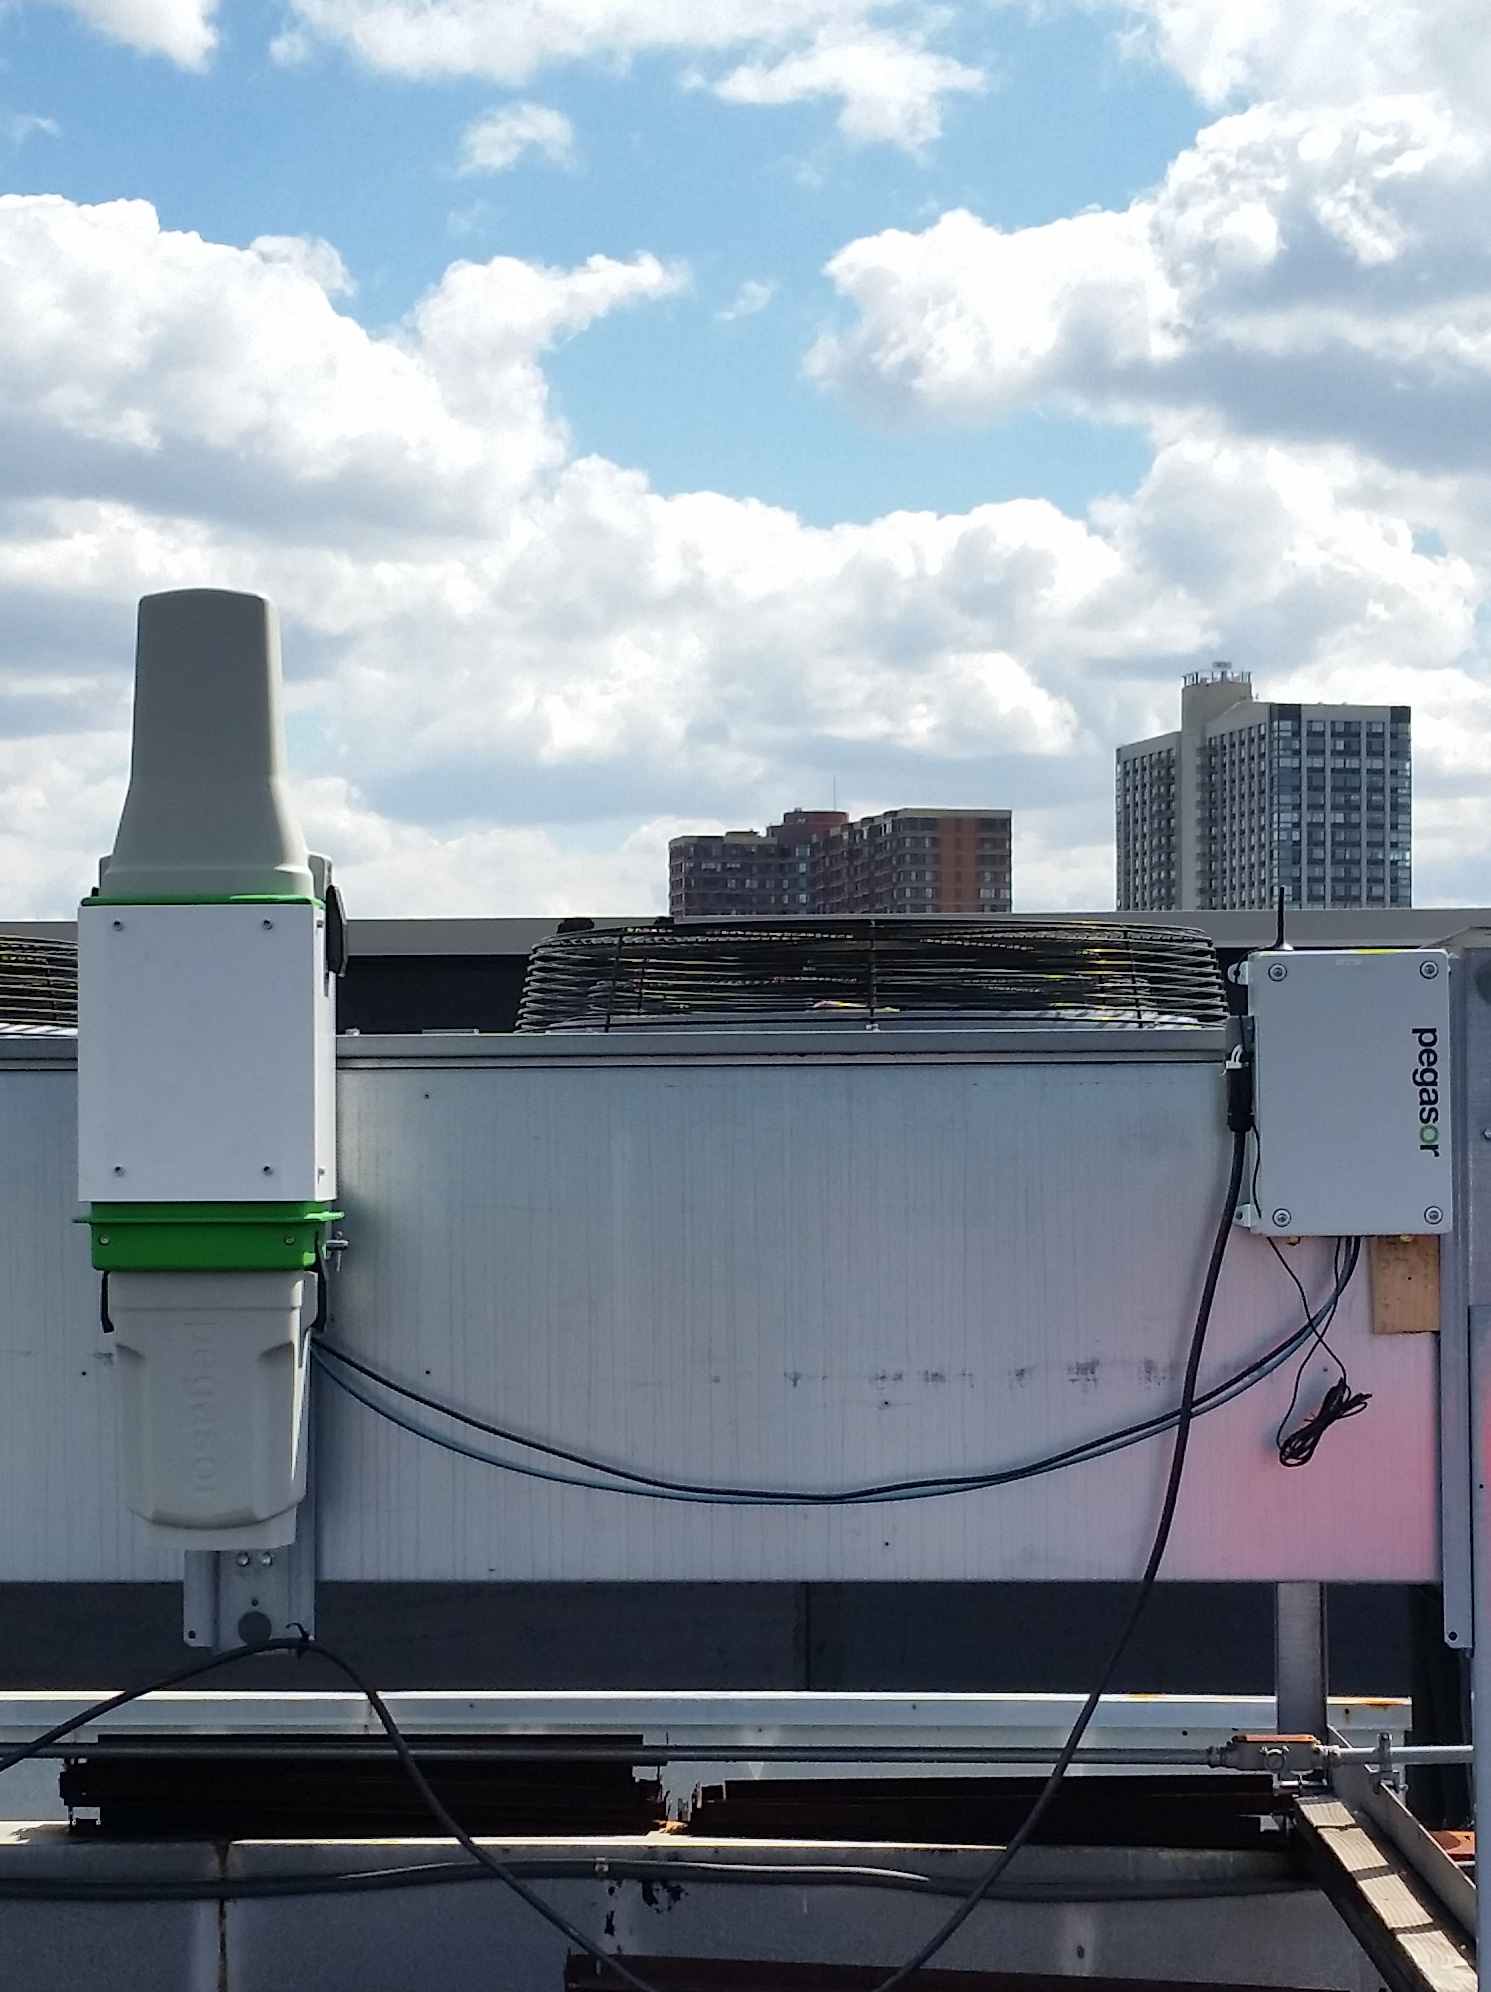
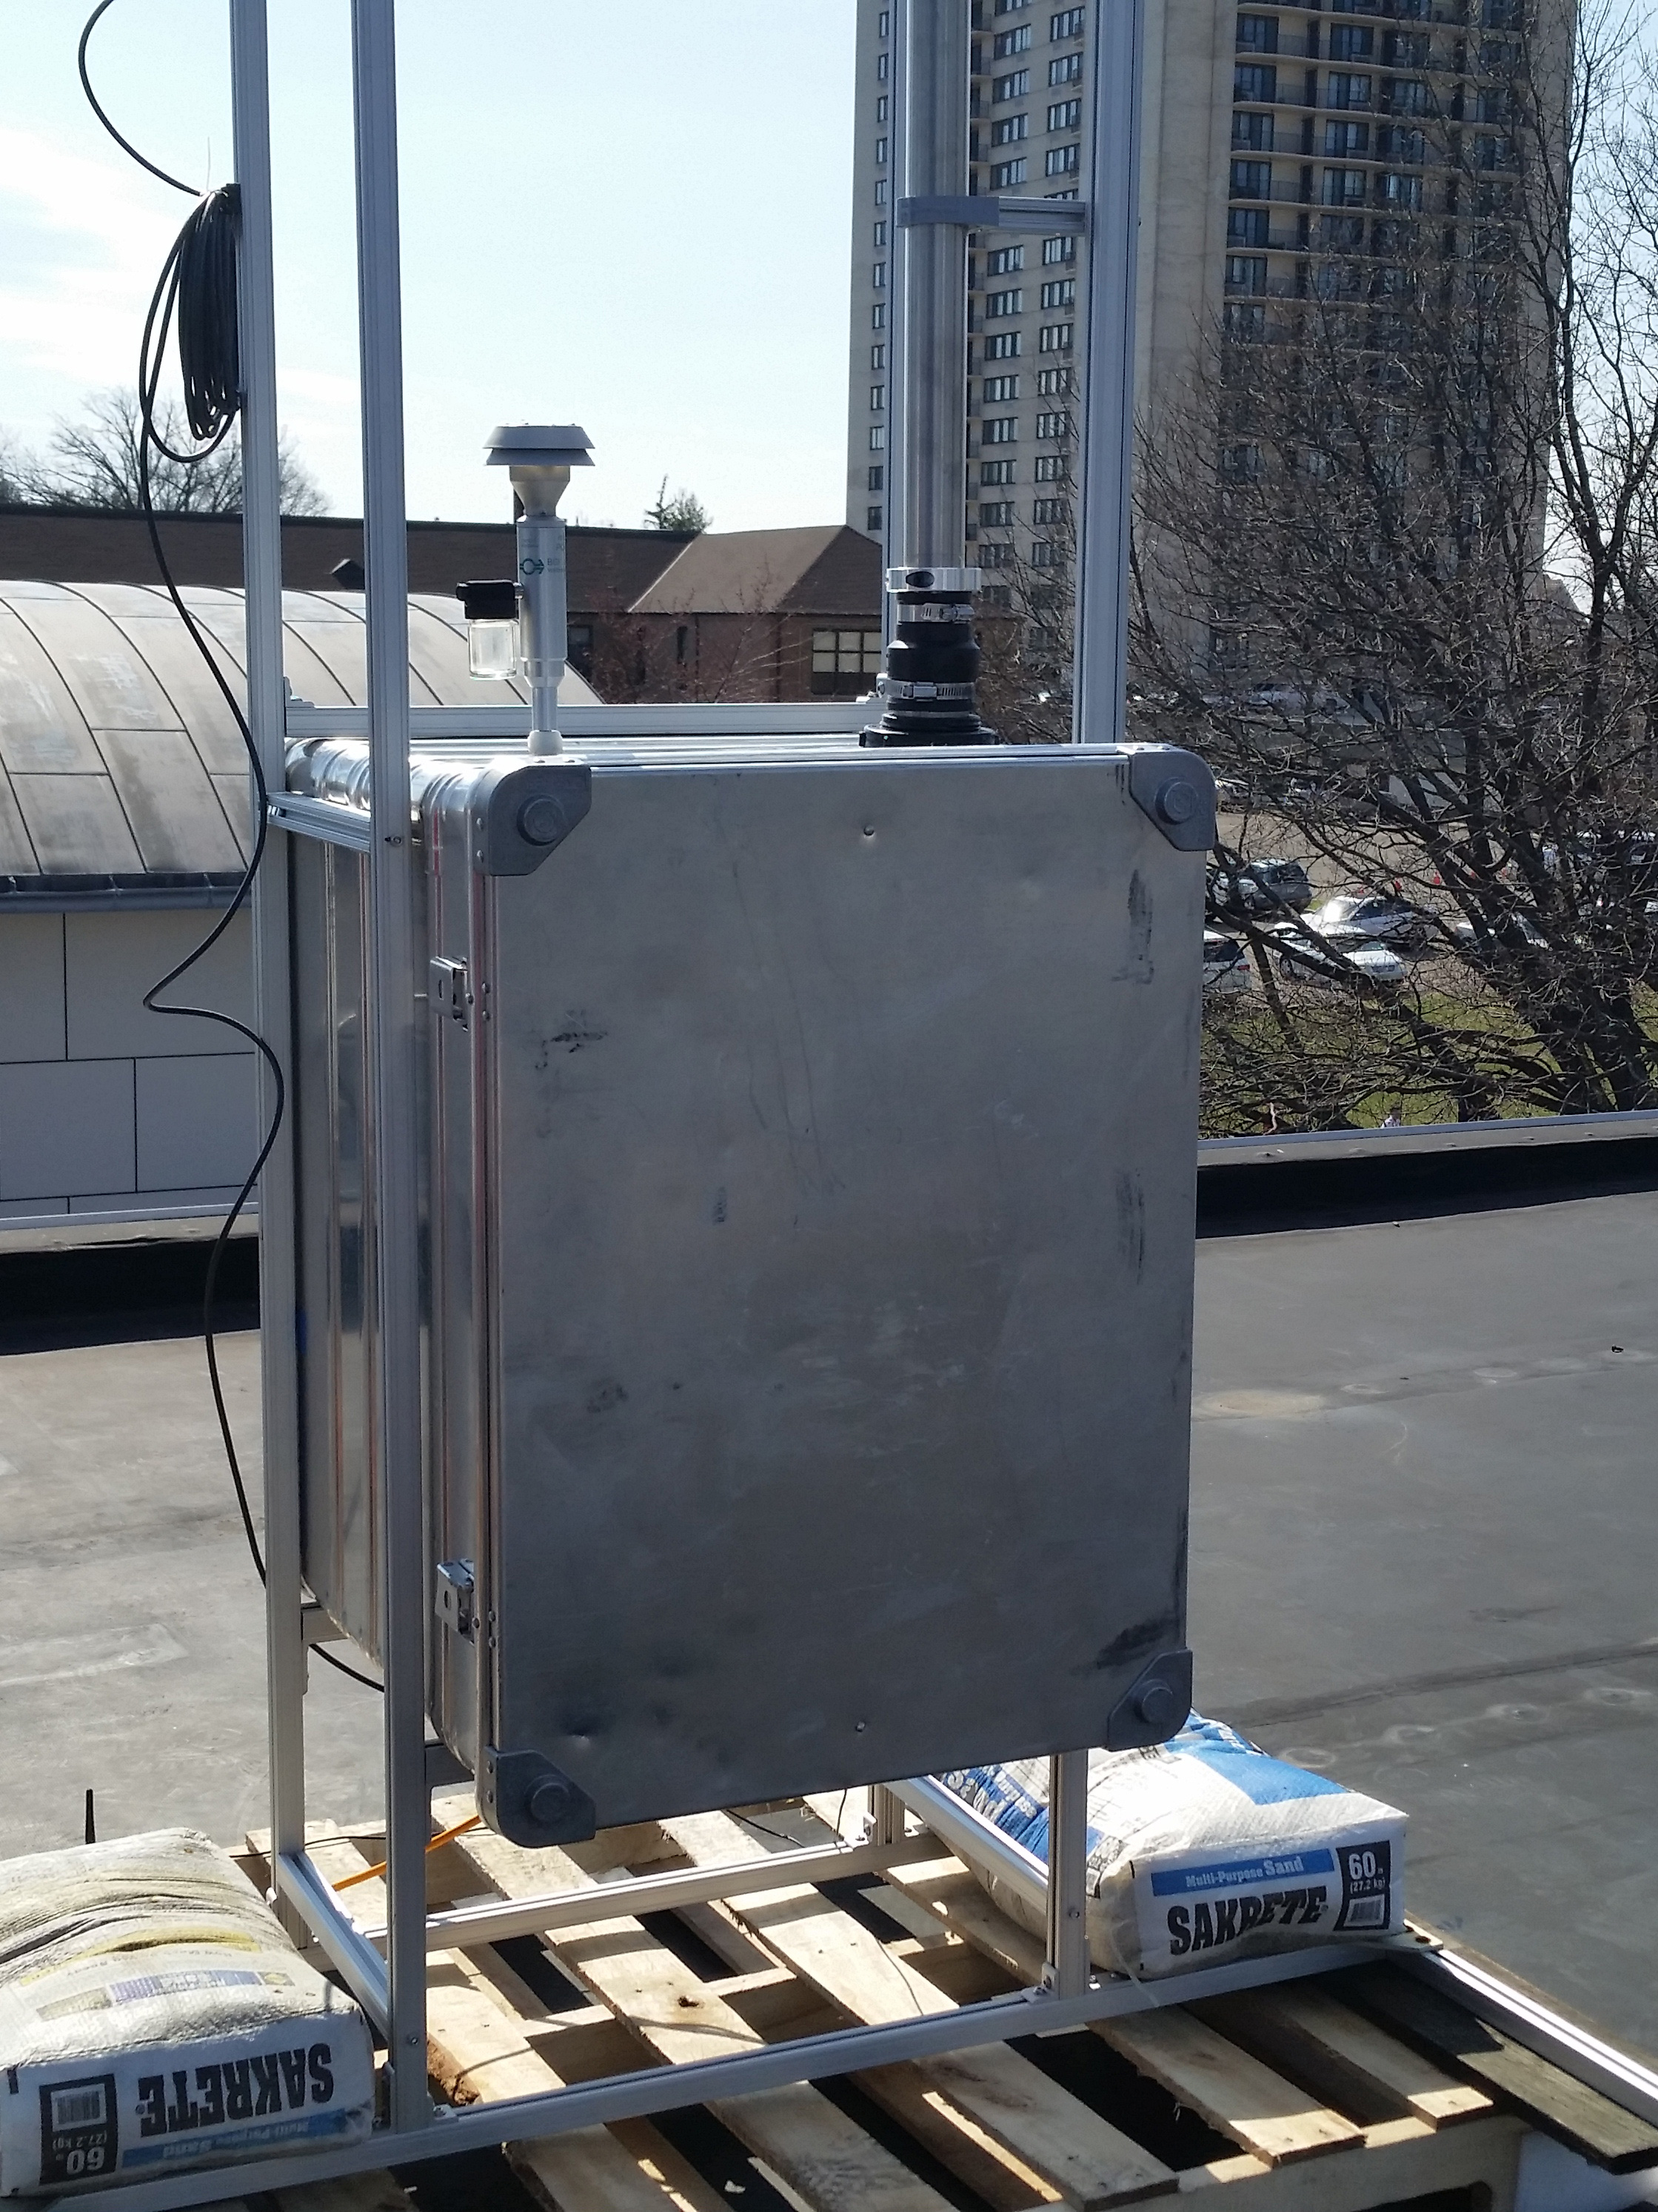 Figure 1. Monitoring locations at (a) the Fort Lee Public Library roof, (b) George Washington Bridge Toll Plaza. Two different cloud based data-logging systems collected data from each devices. A GSM enabled data logger by Realin Oy, Finland collected data from the Pegasor instruments. Envirologger Ltd., UK collected the Partector and Fidas data. Data validation and quality control involved removing all zero and negative values from all datasets. Note that the FRM data analyzed in this study are not yet official because the data have not been reviewed nor submitted to EPA's Air Quality System database. RESULTS AND DISCUSSION Three co-location studies were organized to investigate how well the Pegasor units agree with each other. The correlation coefficients for 2-minute LDSA averages among the urban and indoor units were calculated. Two Pegasor AQUrban devices, units PE-14 and PE-15, were stationed outside a residence adjacent to a highly traveled street in a suburban area in northern New Jersey for 2 days. In this environment, the correlation coefficient was 0.99. A 20-day co-location of AQUrban units PE-13 and PE-14 on the Fort Lee Public Library roof resulted in a 0.92 correlation. Two Pegasor AQIndoor devices were placed in an office for 14 days, and inside an enclosure for 5 days. In both experiments, the correlation was 0.98. The Pegasor units demonstrated that they agree well when comparing LDSA measurements. They were compared with an EPA instrument, which measures PM2.5, to investigate the Pegasor devices with government standards. Daily averages of PM2.5 from Pegasor AQUrban (PE-14) were compared with an EPA Gravimetric Sampler (FRM), which reports every third day at the Fort Lee Public Library Roof. The correlation remained strong at 0.82 between the two instruments for PM2.5 (figs. 2, 3). 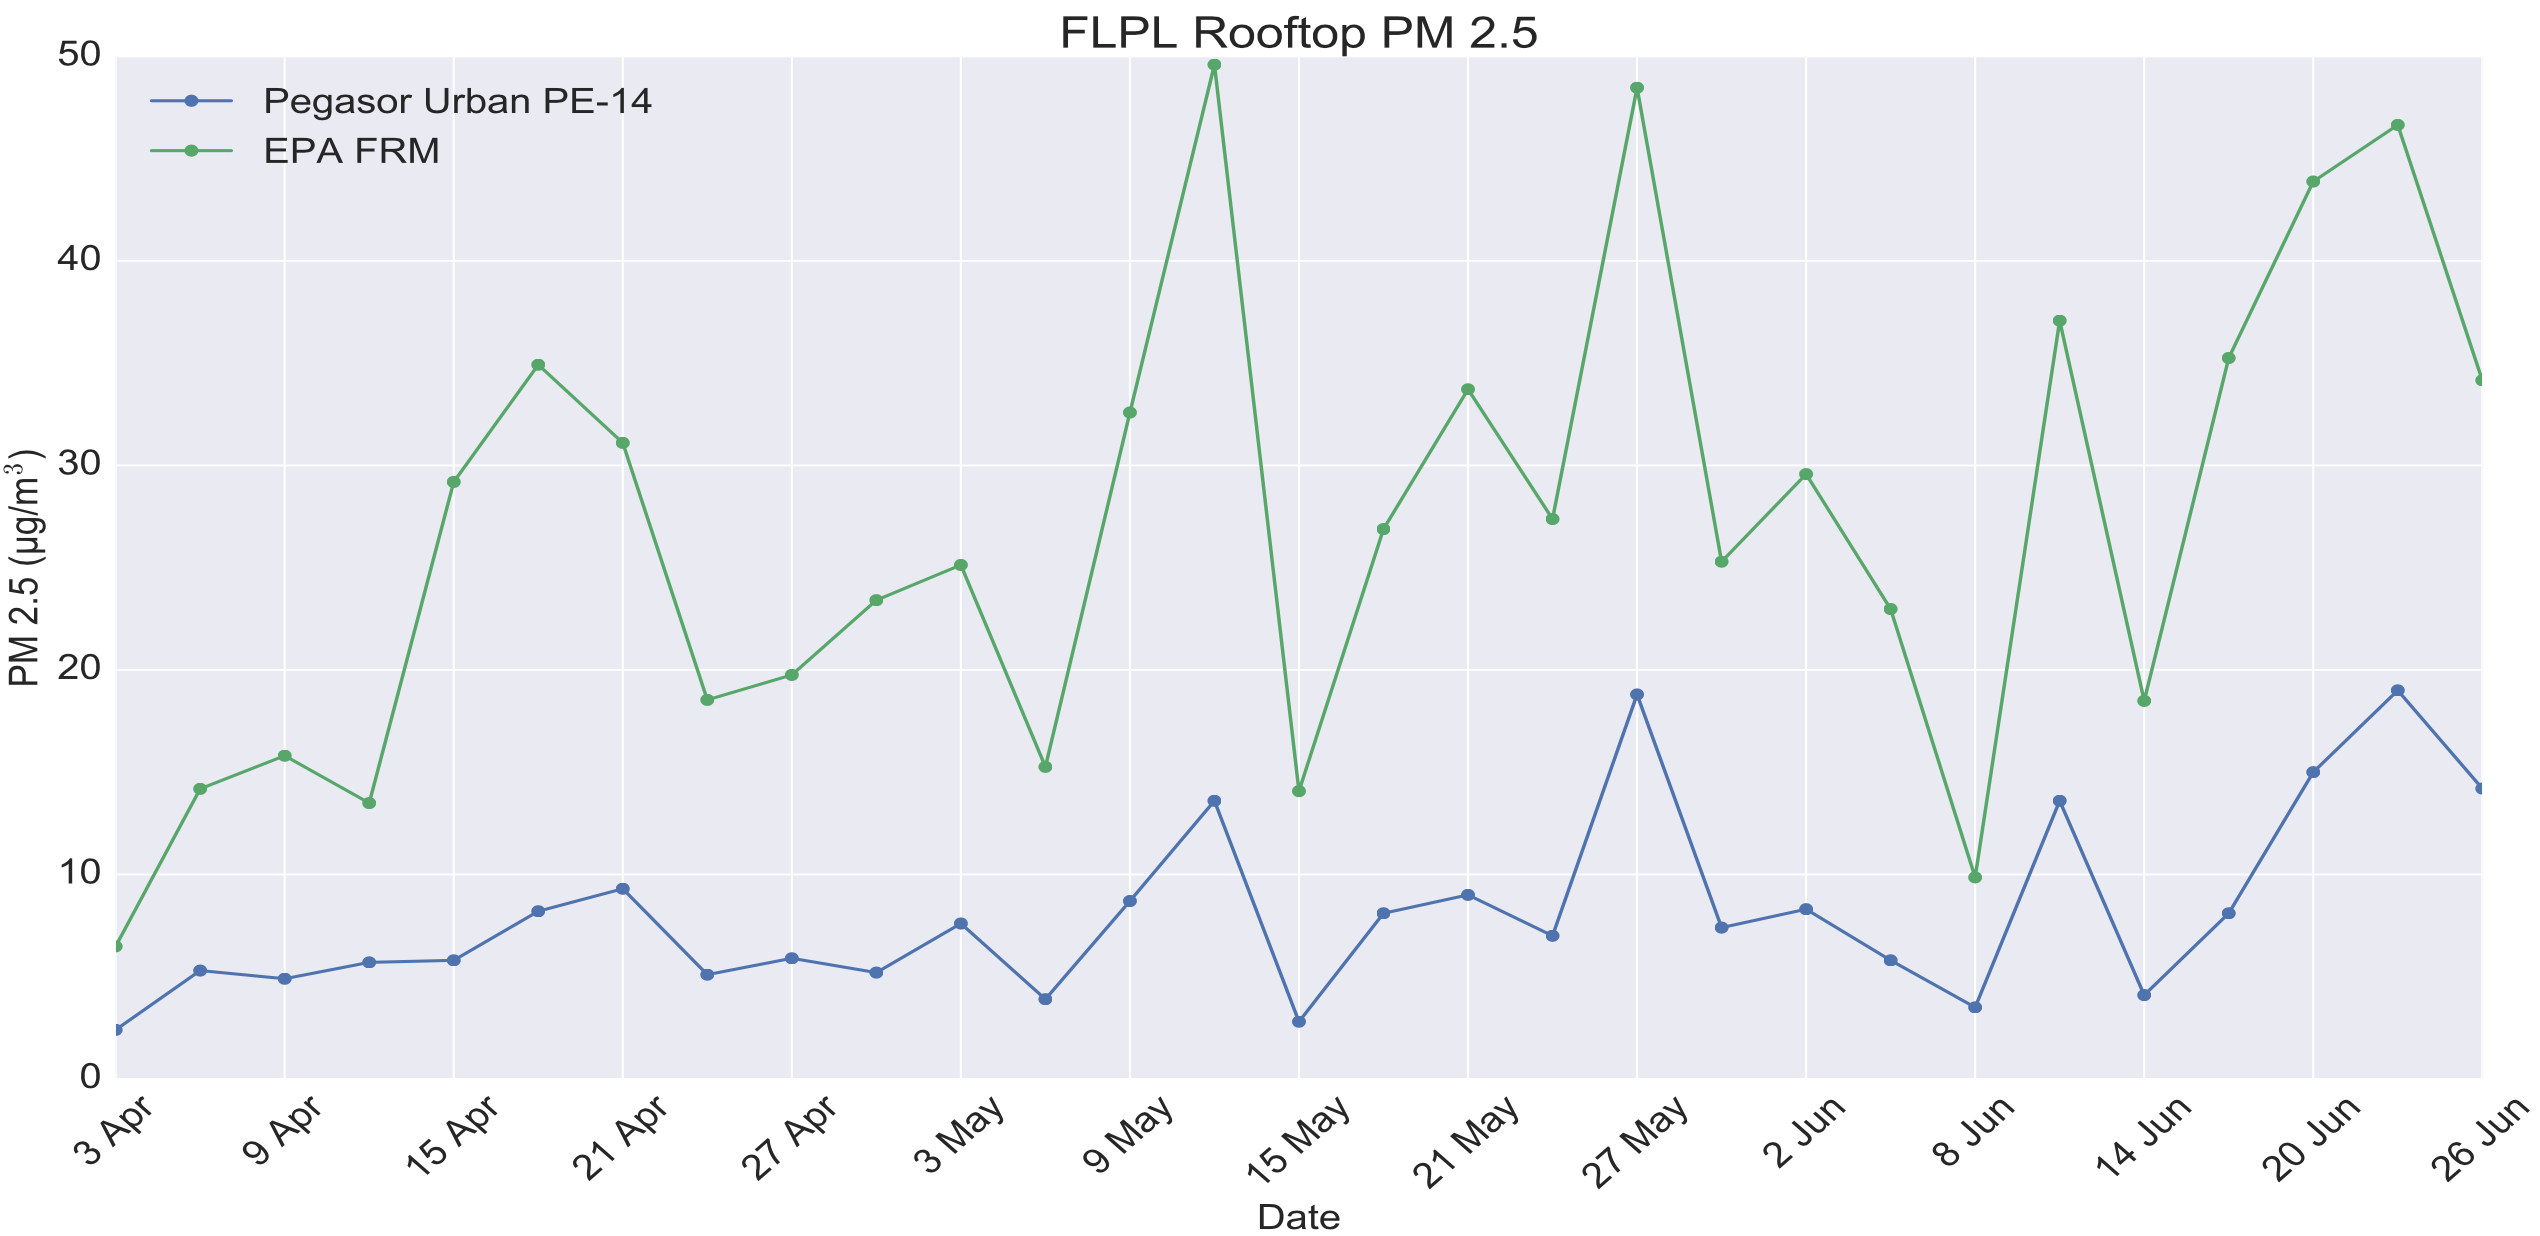 Figure 2. Time series of outdoor PM2.5 at FLPL from PE-14 (blue), FRM (green). 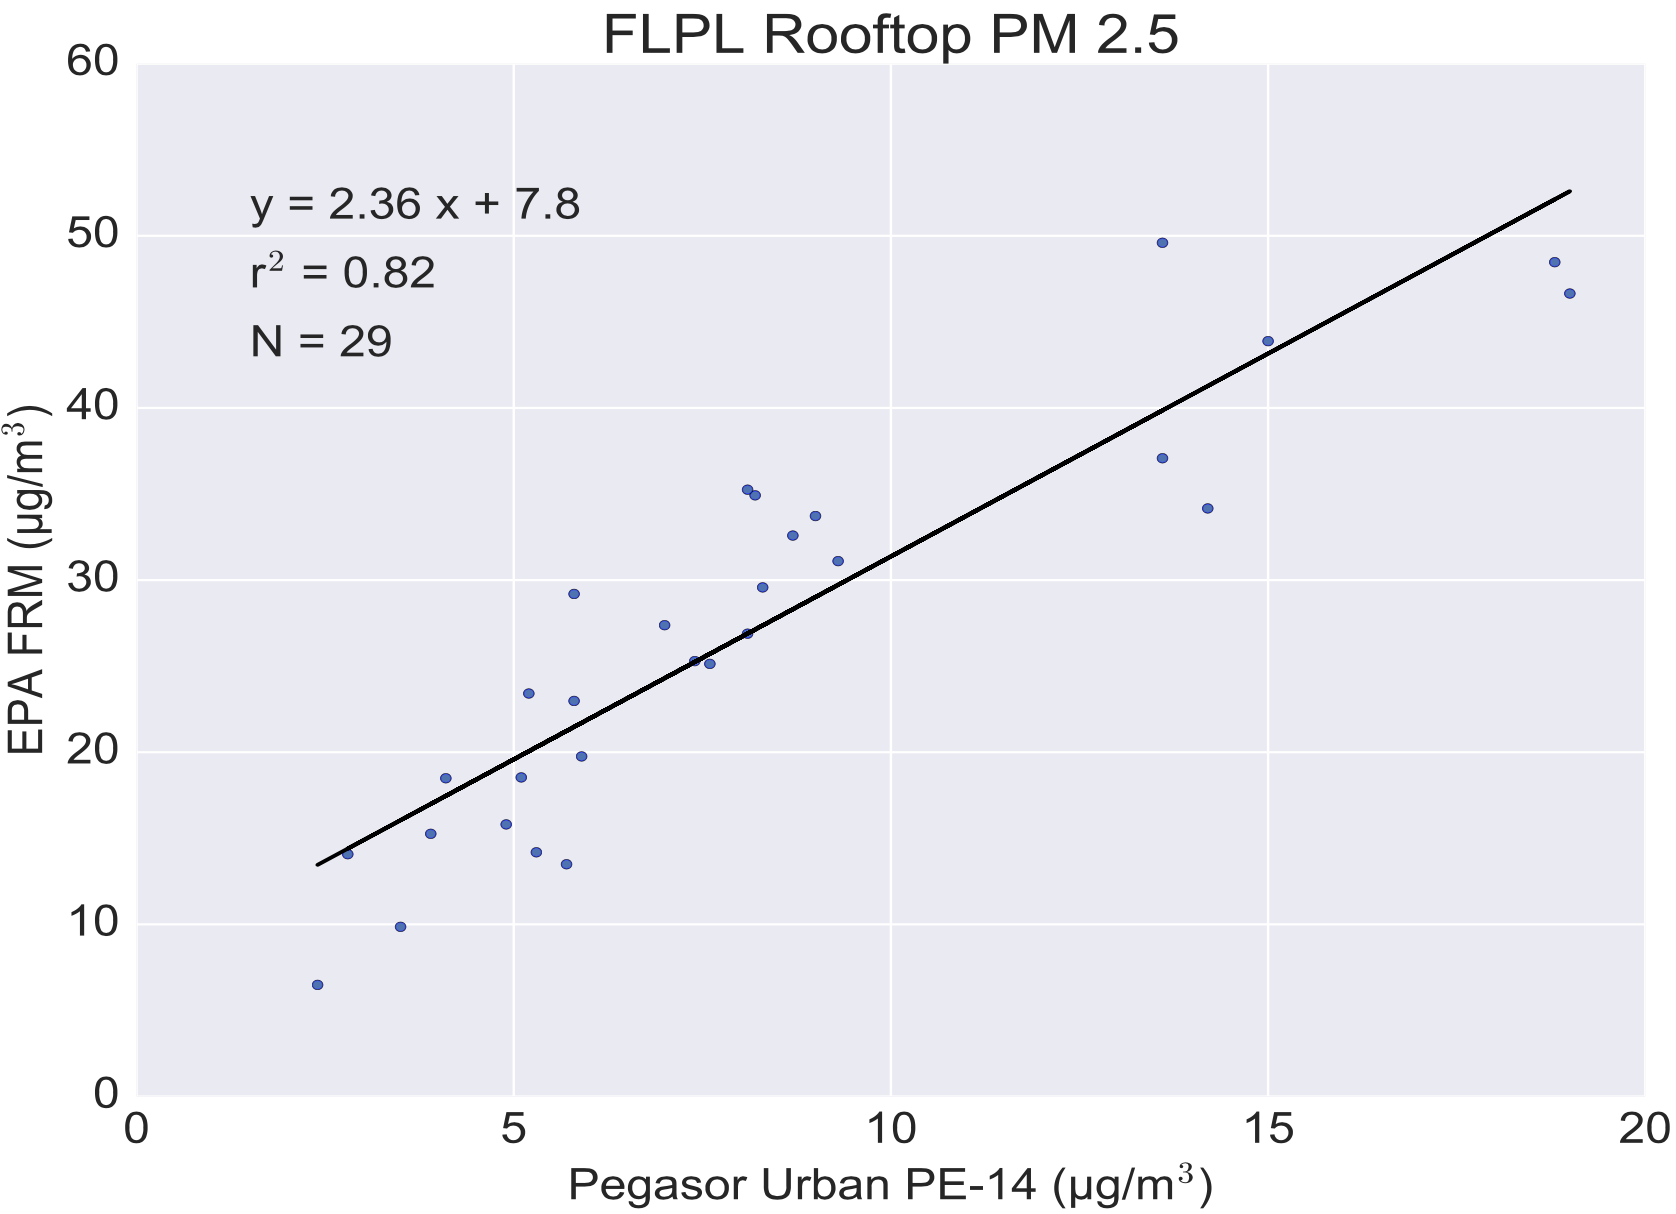 Figure 3. Outdoor PM2.5 correlation at FLPL from PE-14, and EPA FRM. Palas’ Fidas 200 is an EU/UK recognized Optical Particle Spectrometer. We compared particle number measured by the Fidas 200, and Pegasor AQUrban unit PE-14 on top of the Fort Lee Public Library roof. Daily particle number averages yielded a correlation of 0.46 between the two instruments (figs. 6, 7). The Naneos Partector is a comparable device to the Pegasor units in terms of measurement principle. We compare LDSA measurements from the Partector with the Pegasor AQUrban unit PE-14 on the roof of the Fort Lee Public Library. Daily LDSA averages resulted in a 0.93 correlation between the two instruments (figs. 4, 5). 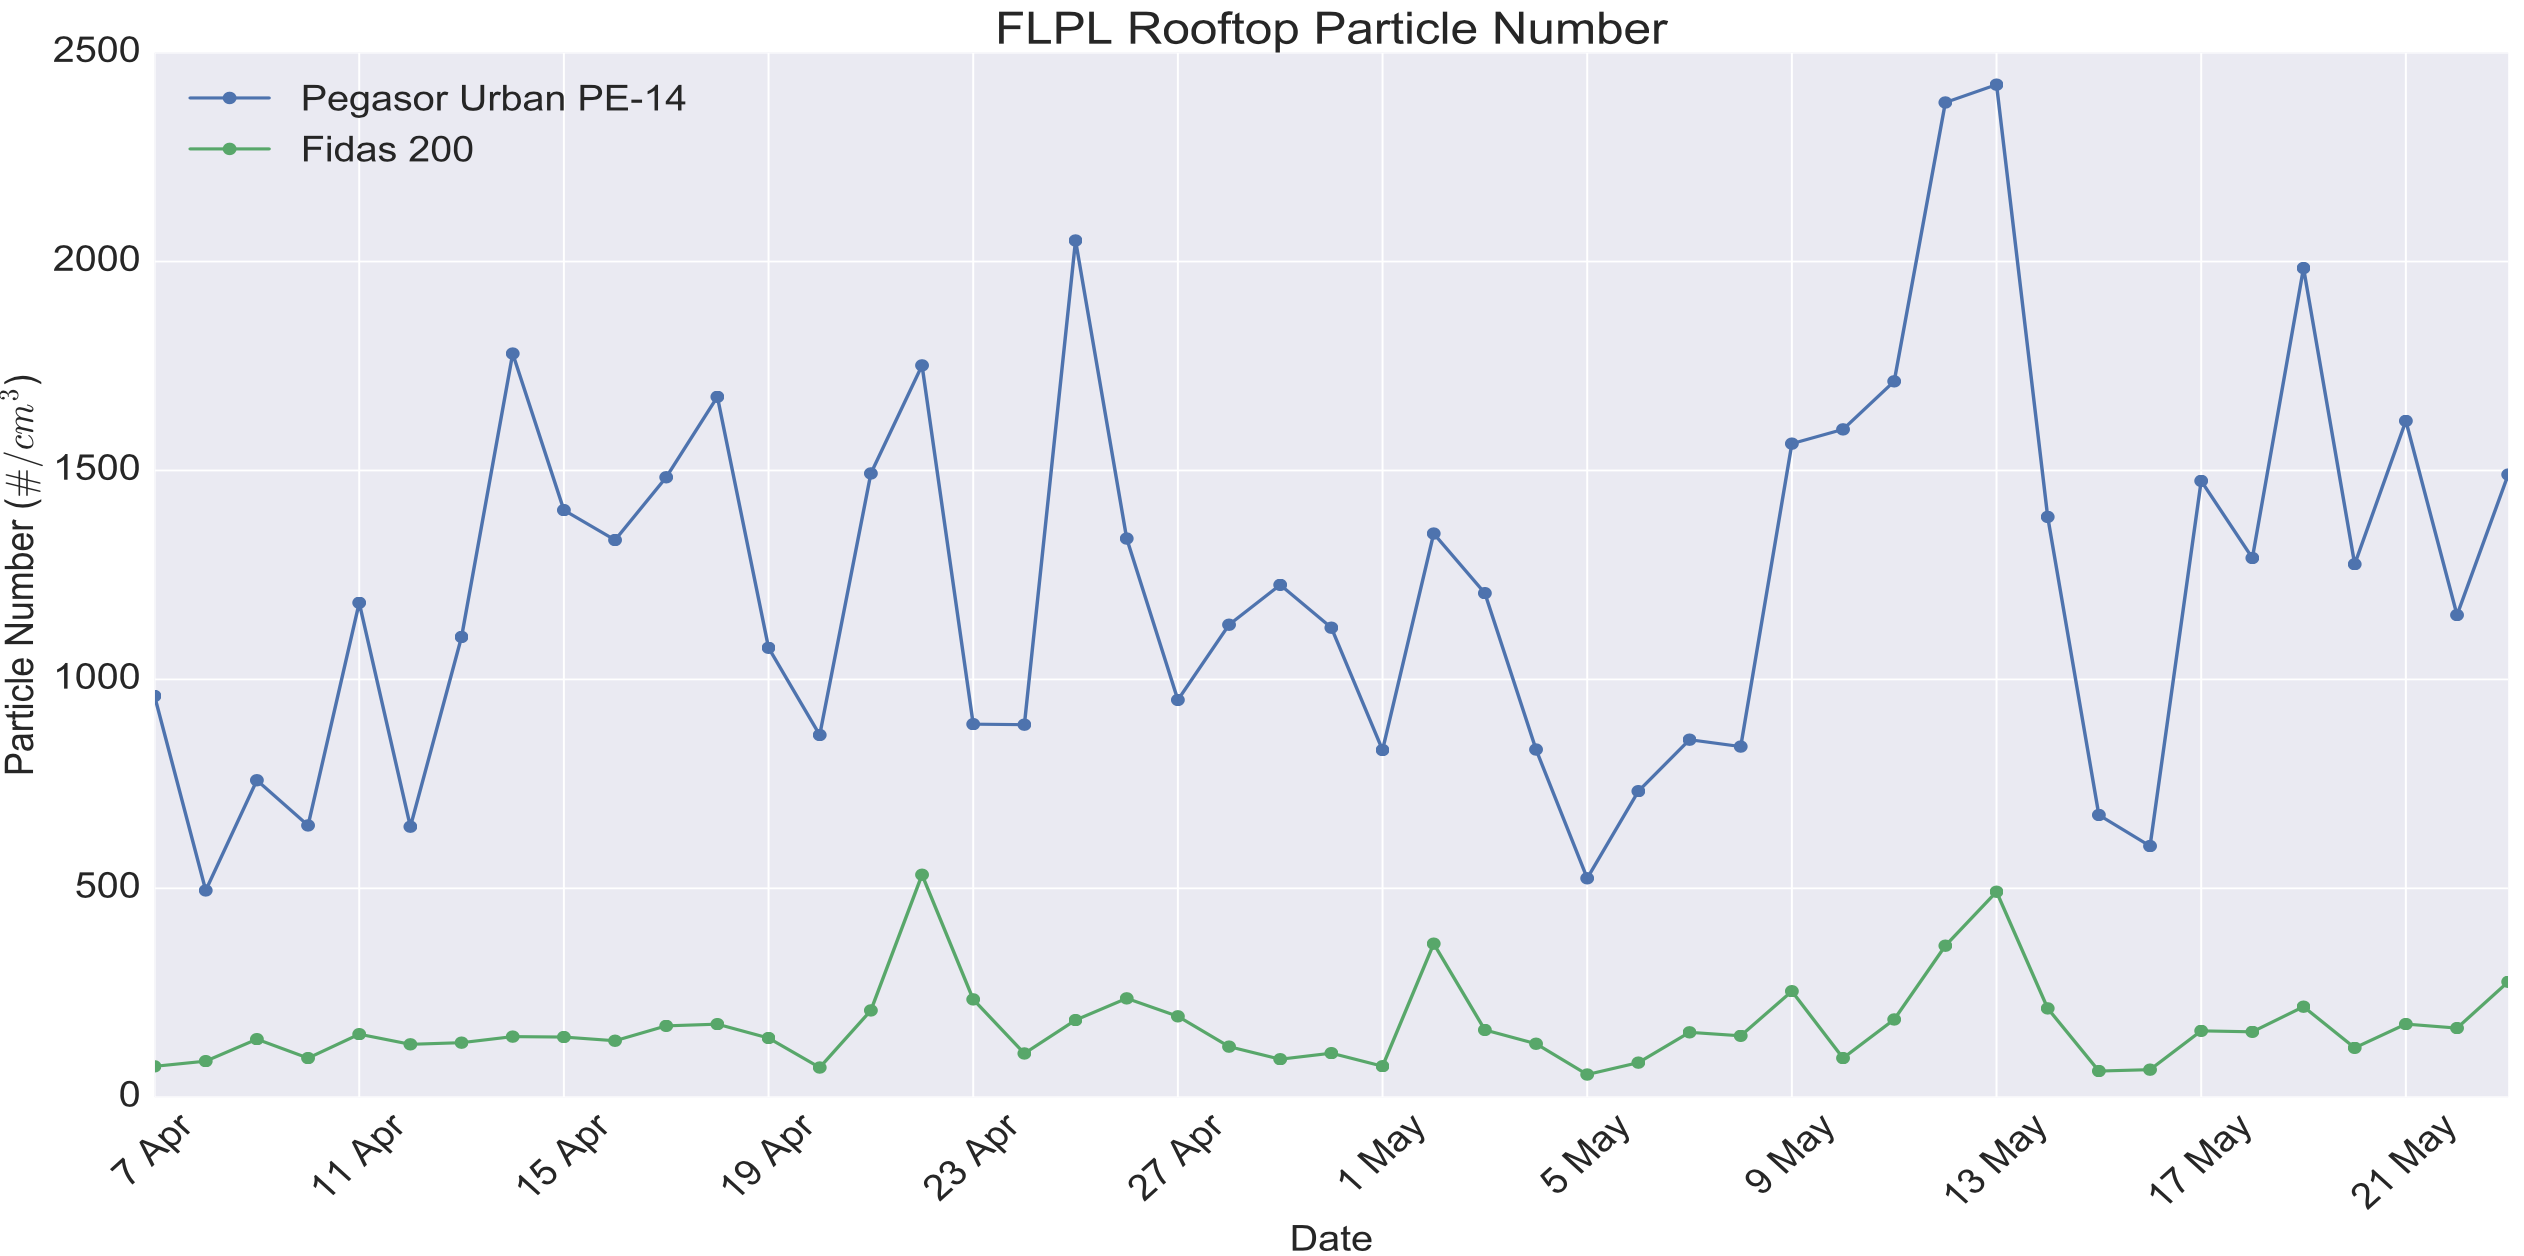 Figure 4. Time series of outdoor Particle Number at FLPL from PE-14 (blue), Fidas 200 (green). 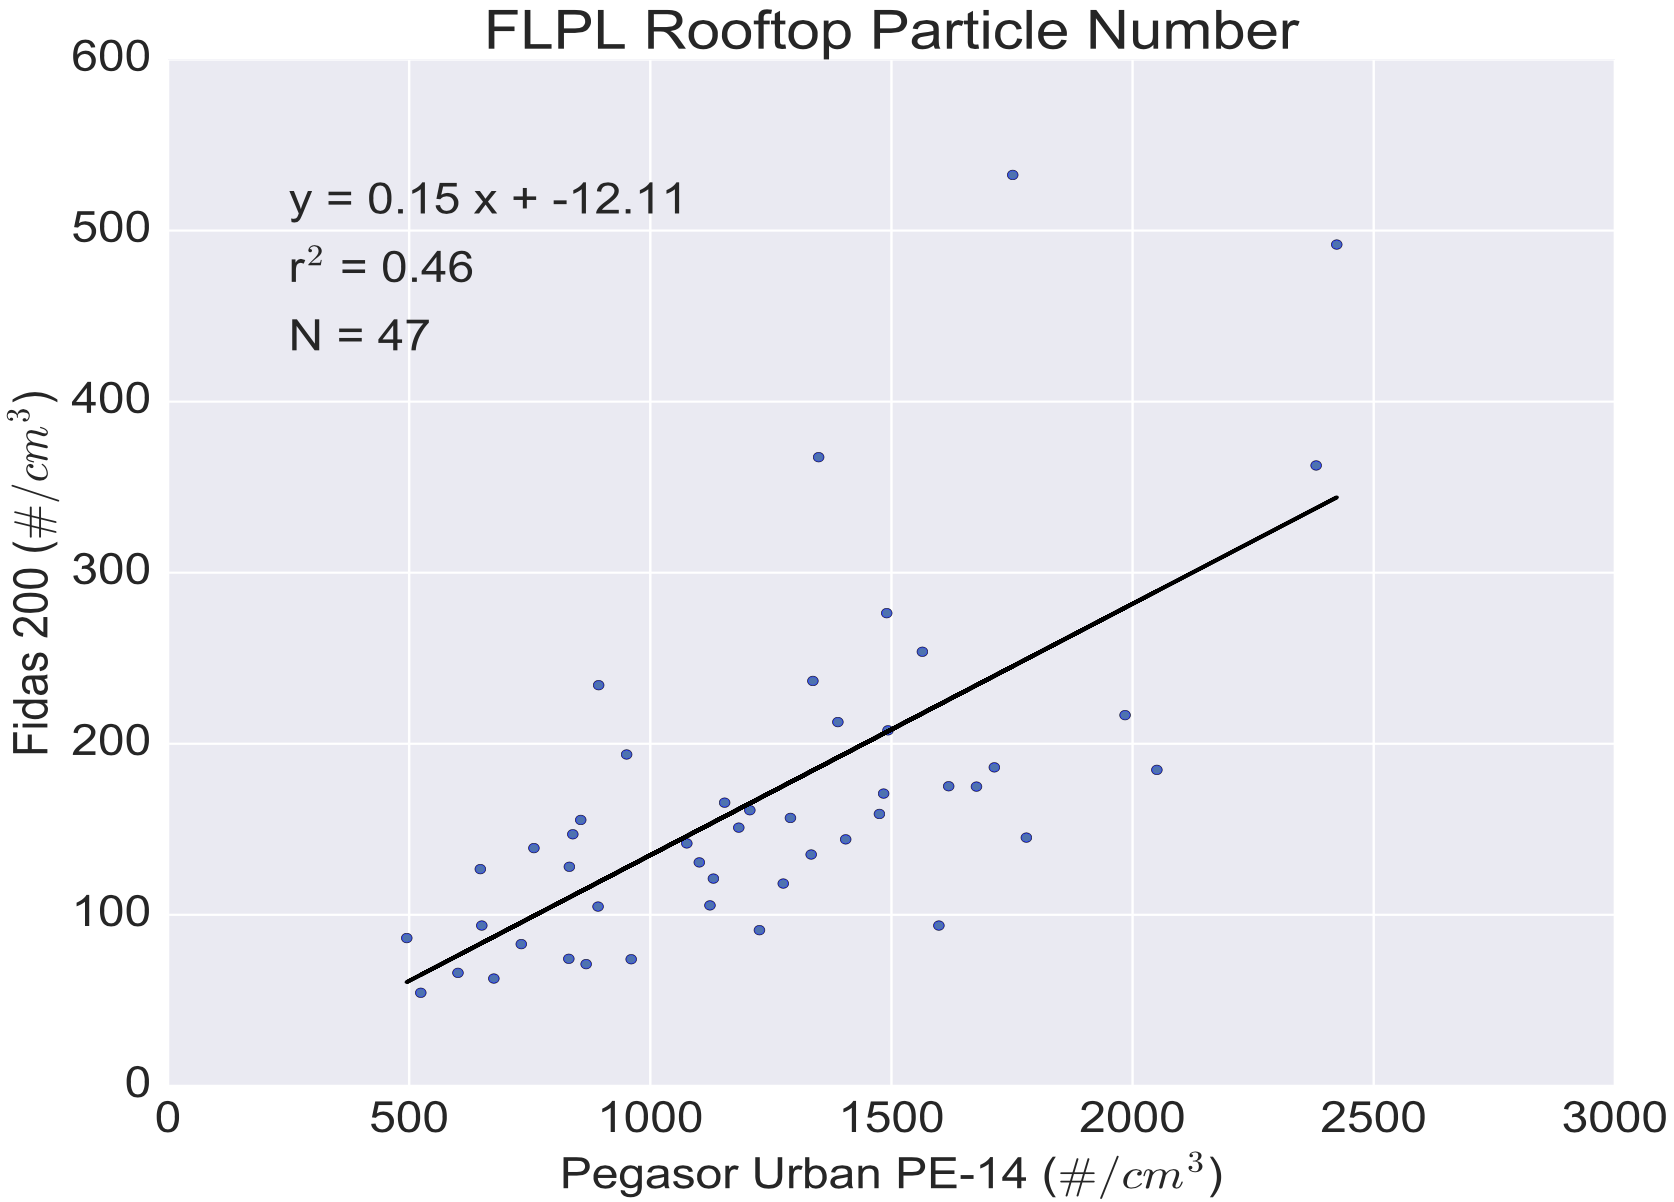 Figure 5. Outdoor PN correlation at FLPL from PE-14, and Fidas 200. There are several possible reasons for why the correlation coefficients were weaker comparing the Pegasor units to a Gravimetric Sampler and the Fidas 200. One is that the optimal size range of detection for electrometer based sensors is 20-300 nm, a region that does not contribute a substantial amount to particle mass concentrations. Further, as an optical particle spectrometer, the Fidas 200 has a detection limit of 200 nm, thus the overlap of particle size range is narrower with the AQUrban. The relatively small sample sizes could affect the statistical power of the associations under scrutiny. Lastly, size selective inlets were not used for the AQUrban devices. The Pegasor AQUrban device agreed well with the Naneos Partector, which utilizes similar measuring principles and has the same size range of optimal detection (figs. 6, 7). 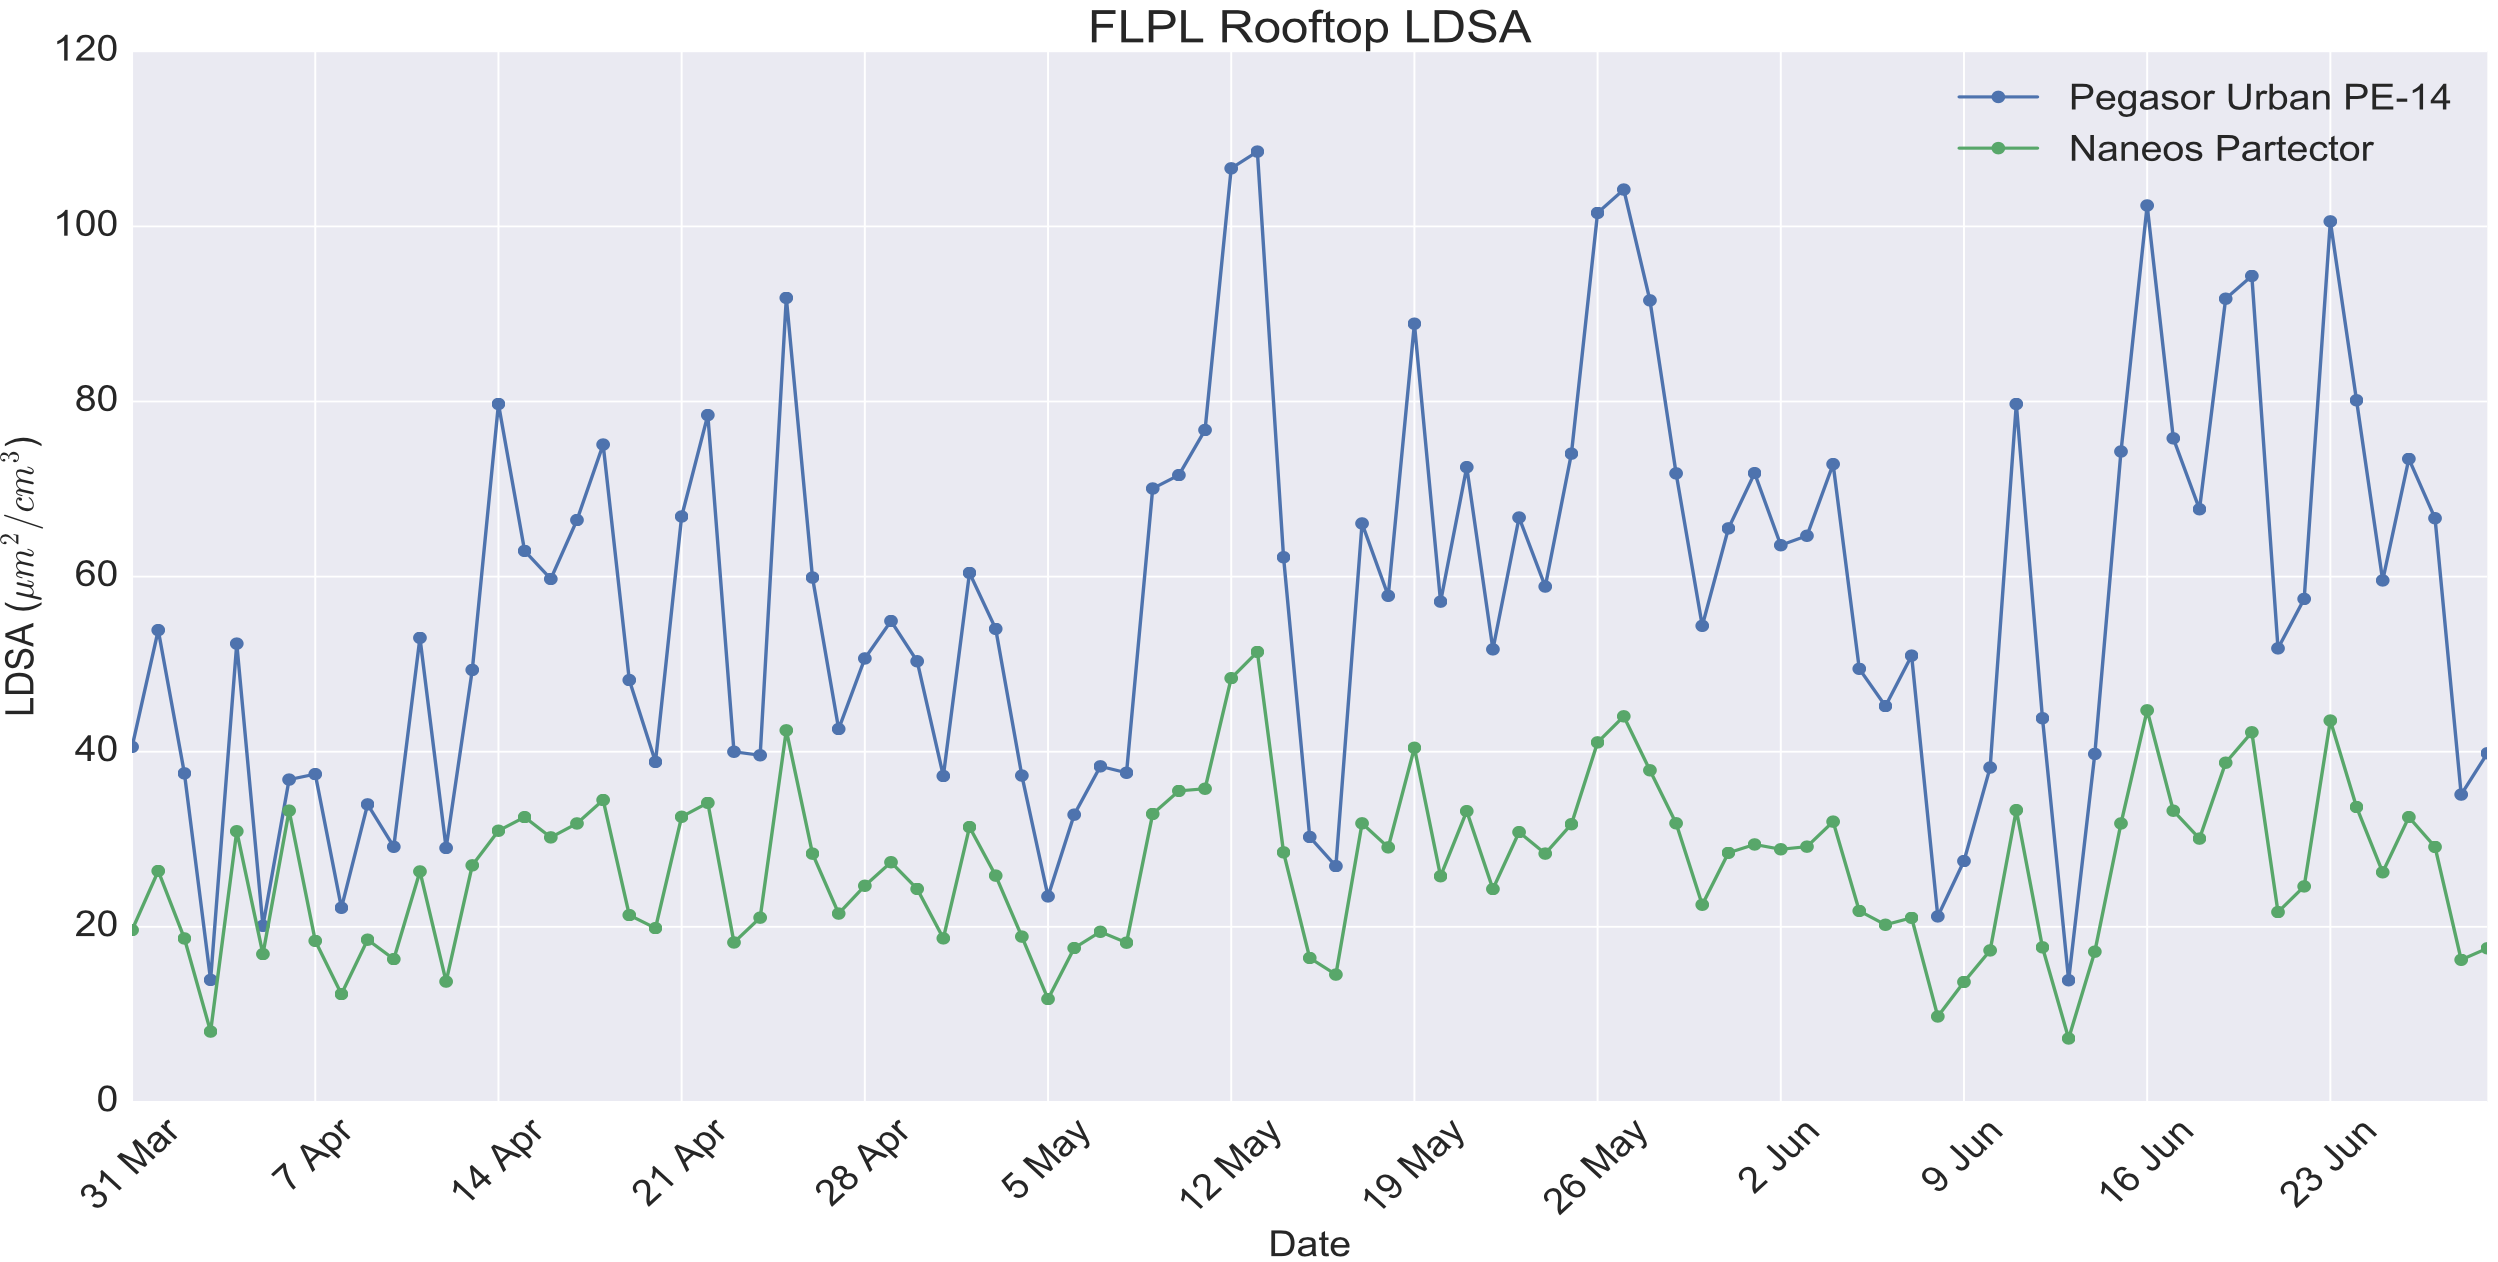 Figure 6. Time series of outdoor LDSA at FLPL from PE-14 (blue), Partector (green). 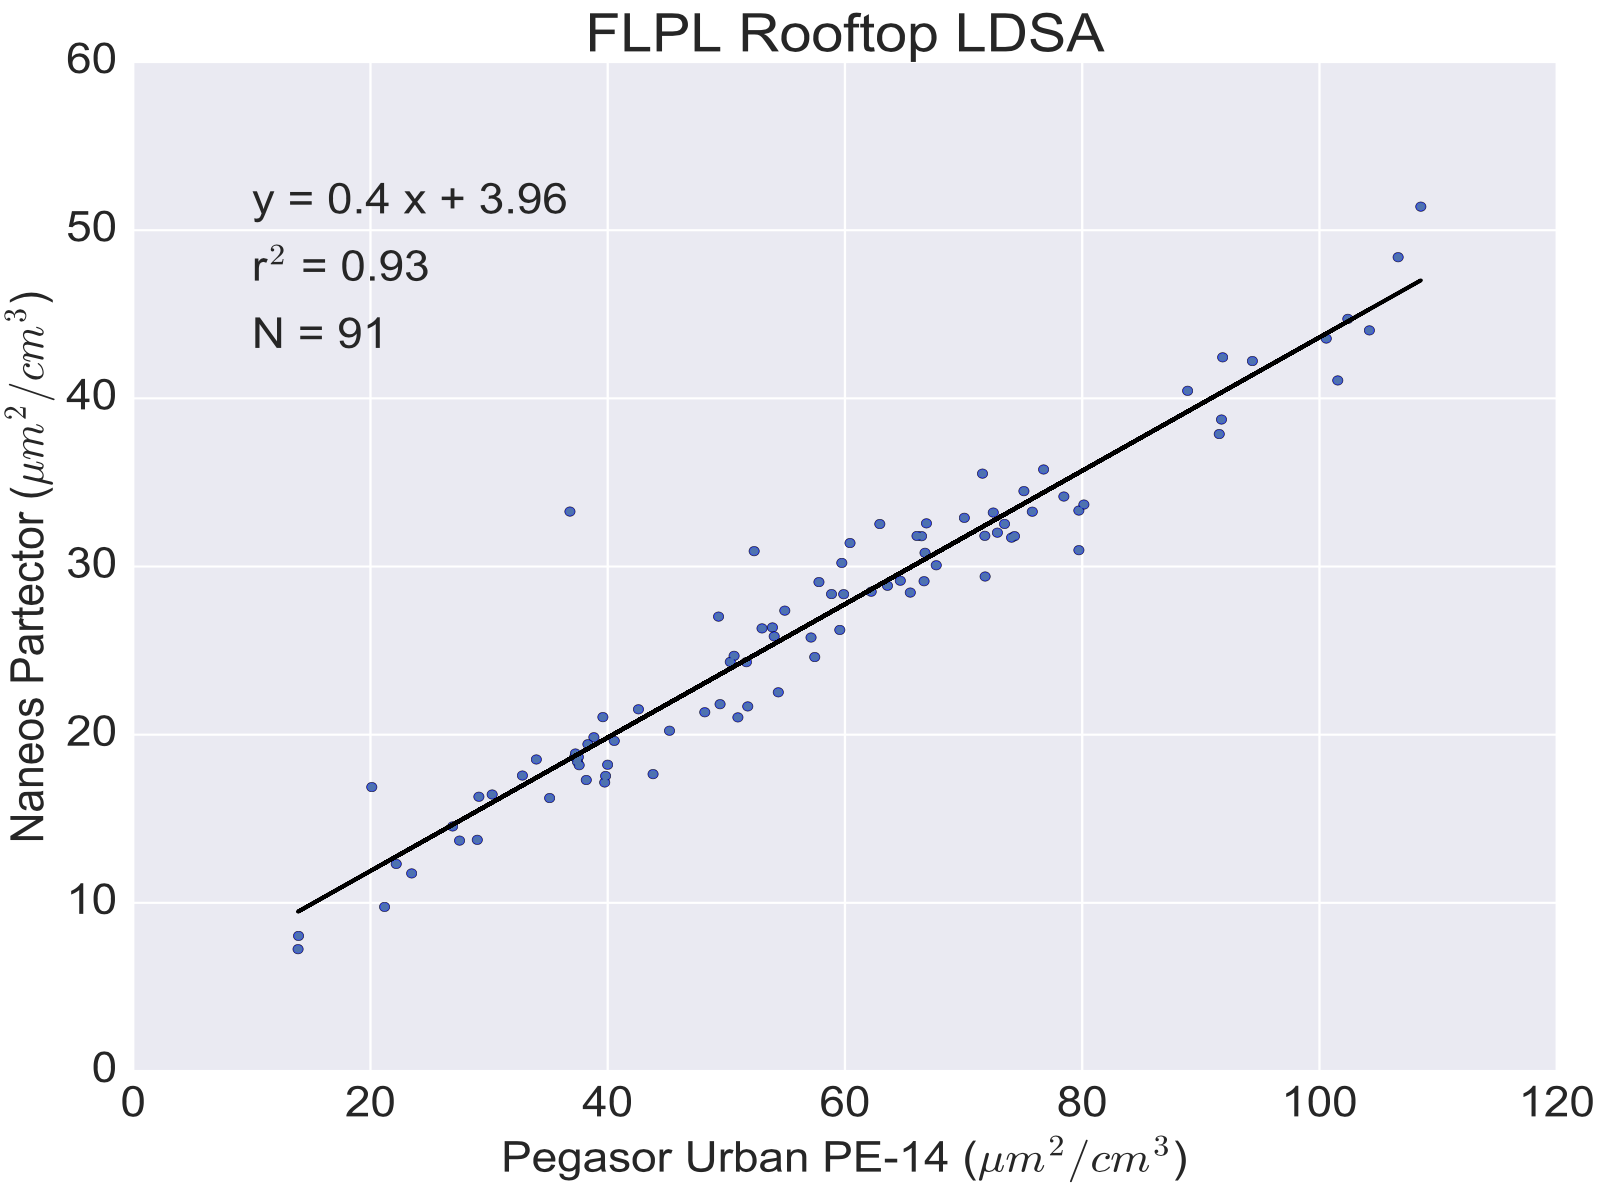 Figure 7. Outdoor LDSA correlation at FLPL from PE-14, and Partector. Indoor and Outdoor LDSA measurements were compared at the Fort Lee Public Library to quantify the indoor/outdoor (I/O) ratio of UFPs. A Pegasor AQIndoor was placed in the Children’s Reading Room where it captured the influence of human activity and changes in ambient concentrations when building doors were opened. Figure 9 shows that the correlation between indoor and outdoor LDSA was relatively weak (R2 = 0.33). Although there are times the indoor LDSA exceeds those outdoors, the average I/O ratio is 0.25 indicating LDSA in the Children’s Reading Room is lower than ambient concentrations for most of the monitoring period (fig. 8). The time series indicates there may be indoor sources that cause local peaks in LDSA. Figure 10 shows hourly averages of outdoor and indoor LDSA and I/O ratios with green shading indicating times when the library is open. Indoor LDSA trends follow outdoor LDSA, particularly as the library is in use. 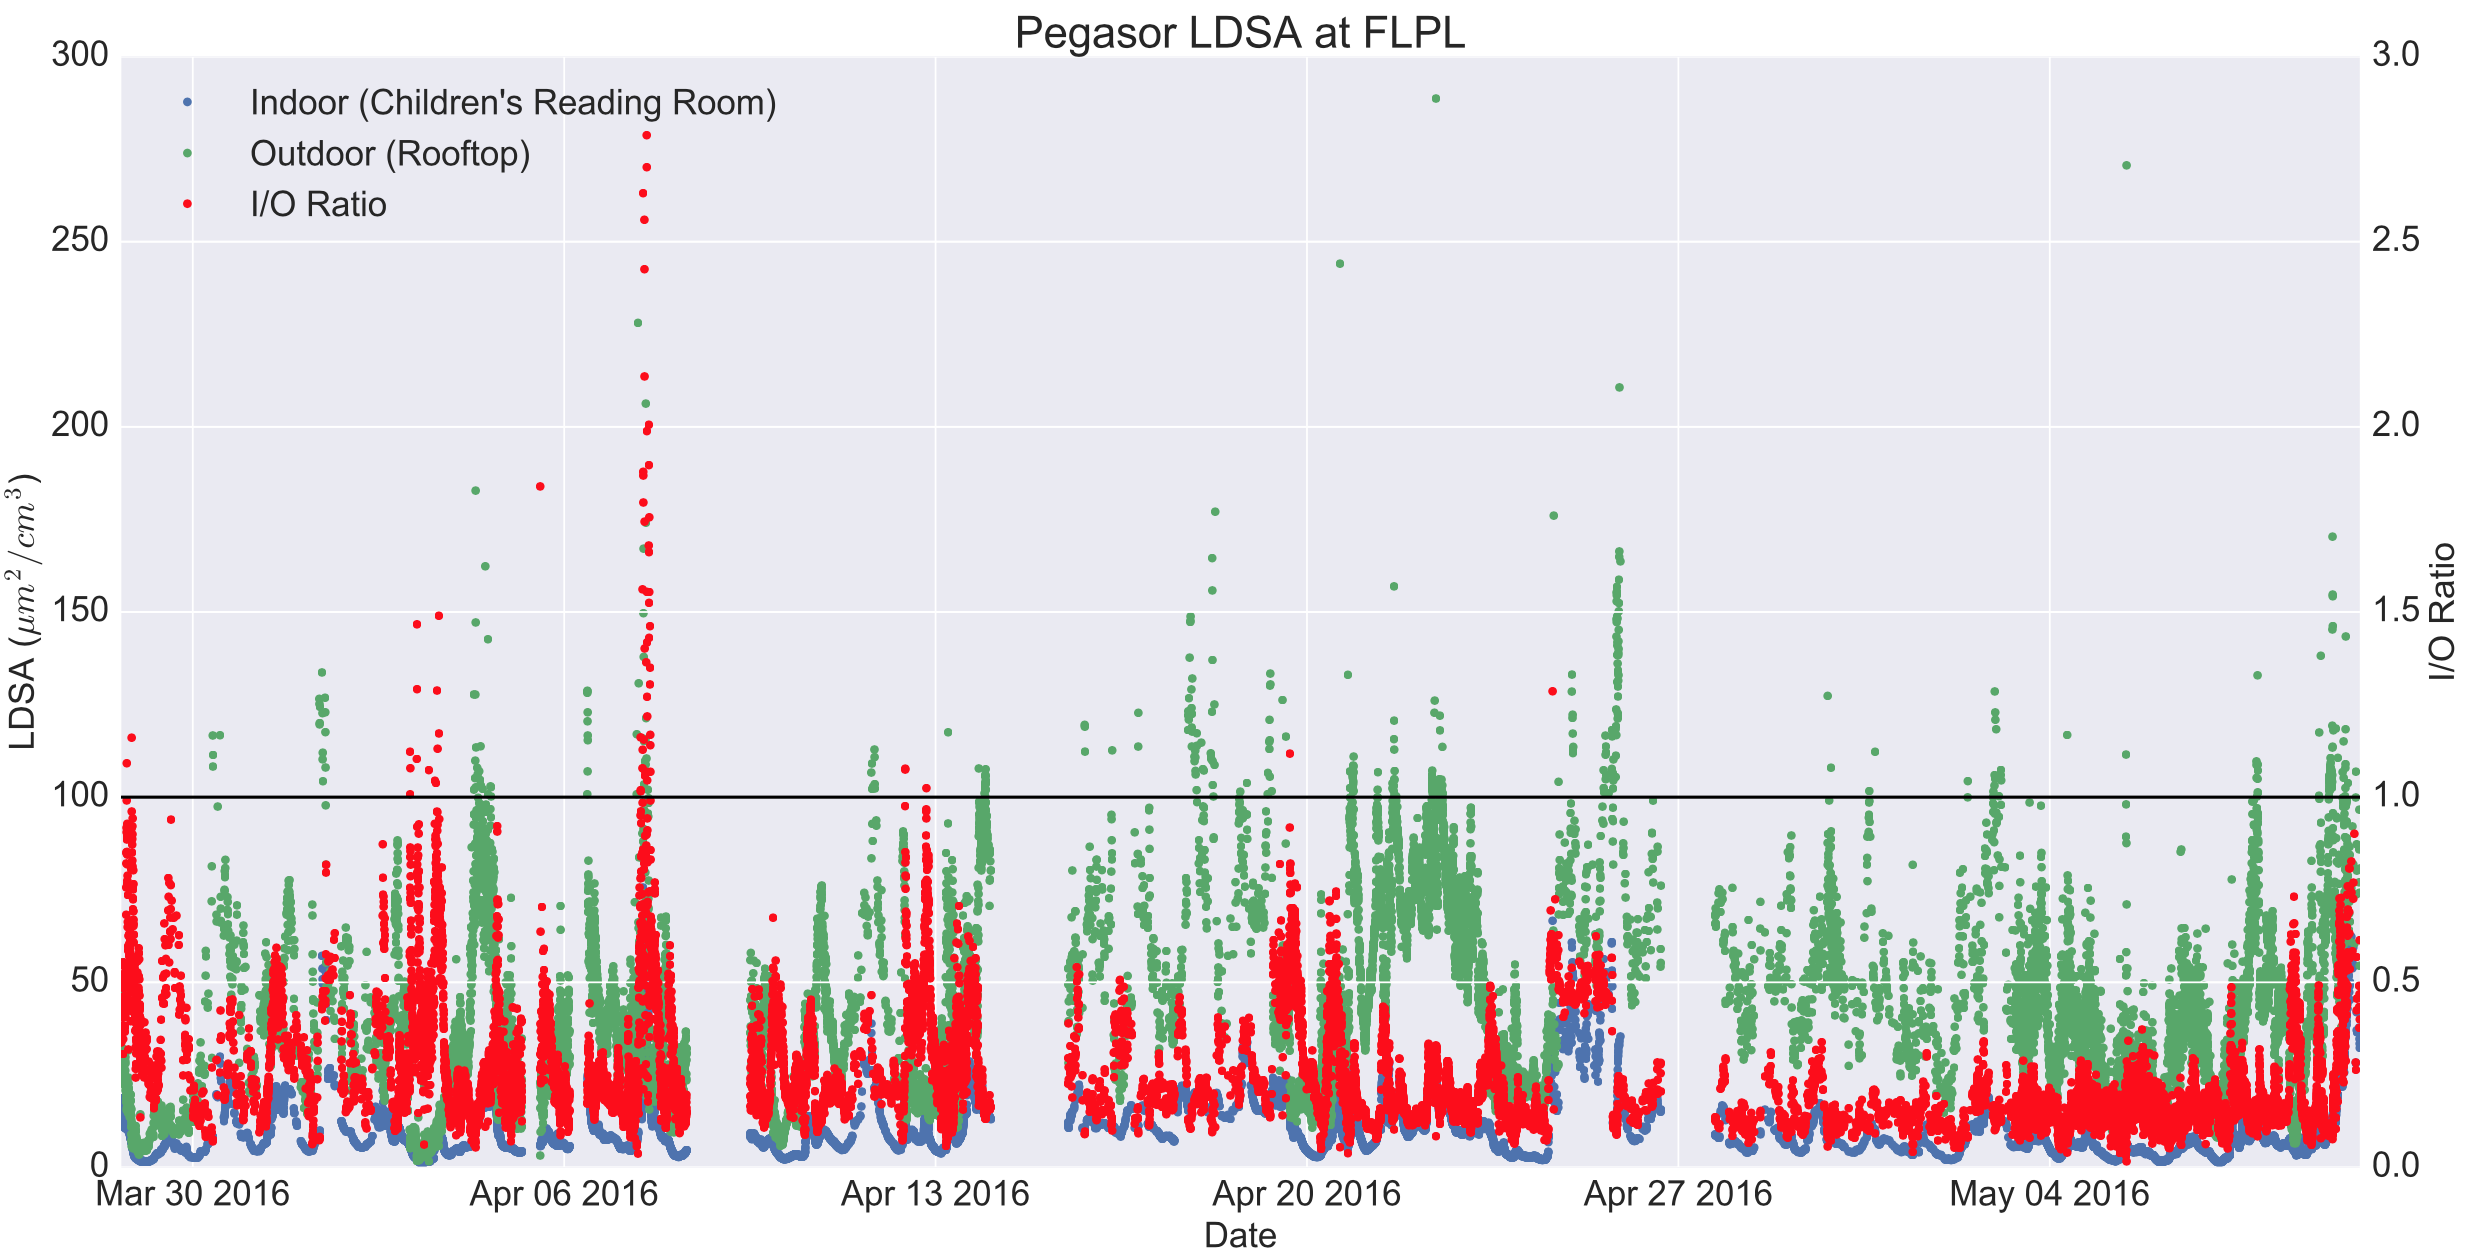 Figure 8. Time series of indoor (blue), outdoor (green), I/O (red) LDSA at FLPL. Black line indicates I/O ratio = 1. 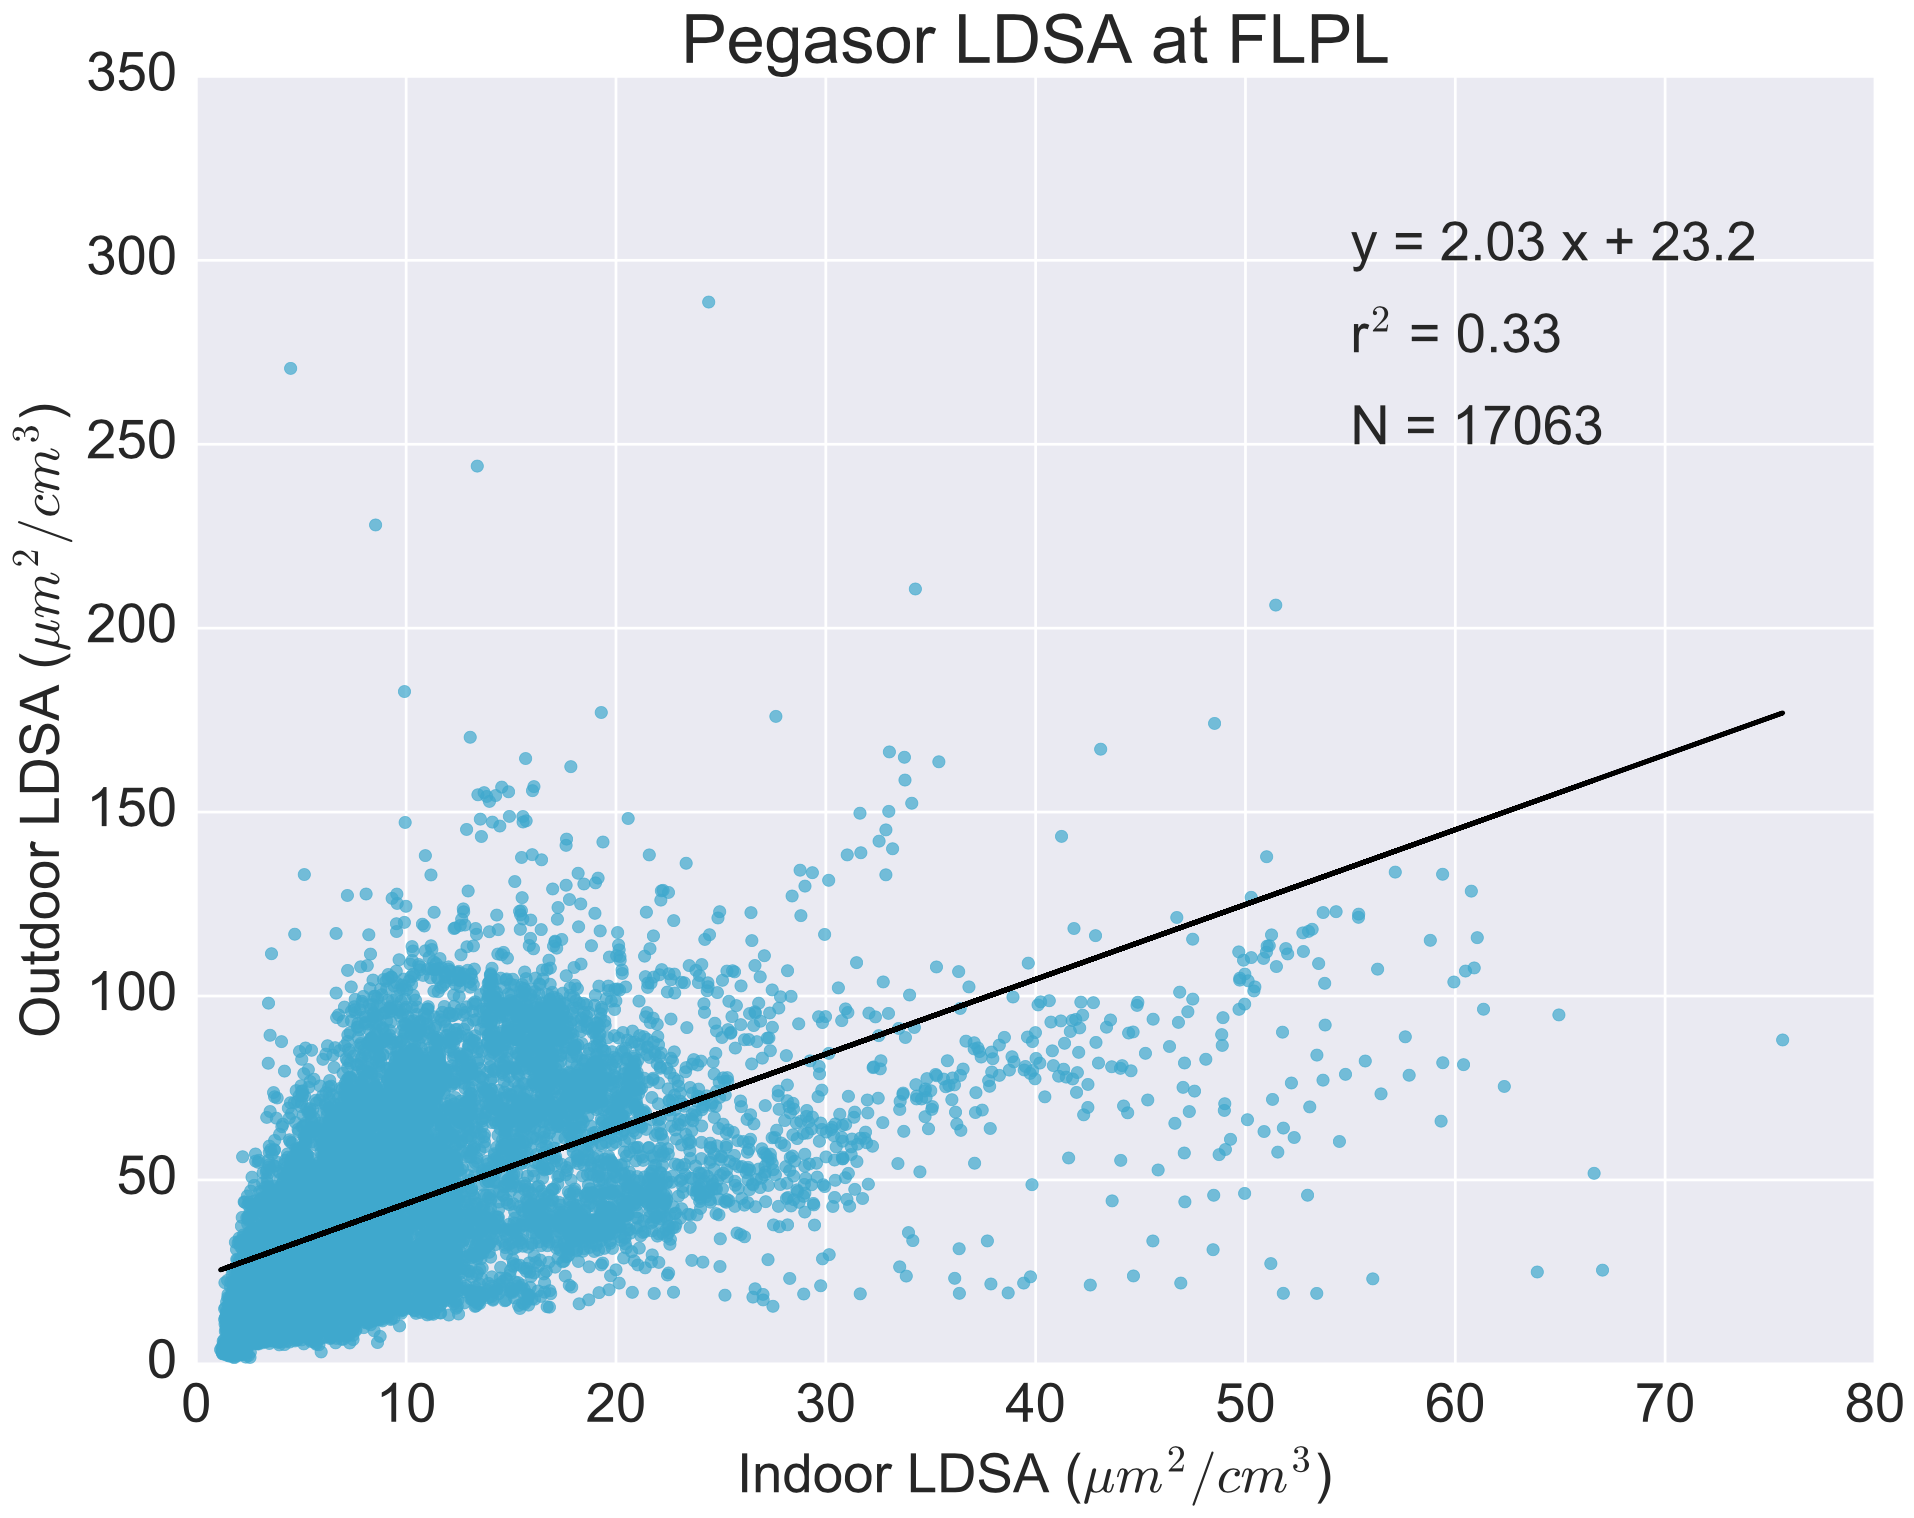 Figure 9. Indoor and outdoor LDSA correlation from Pegasor units. 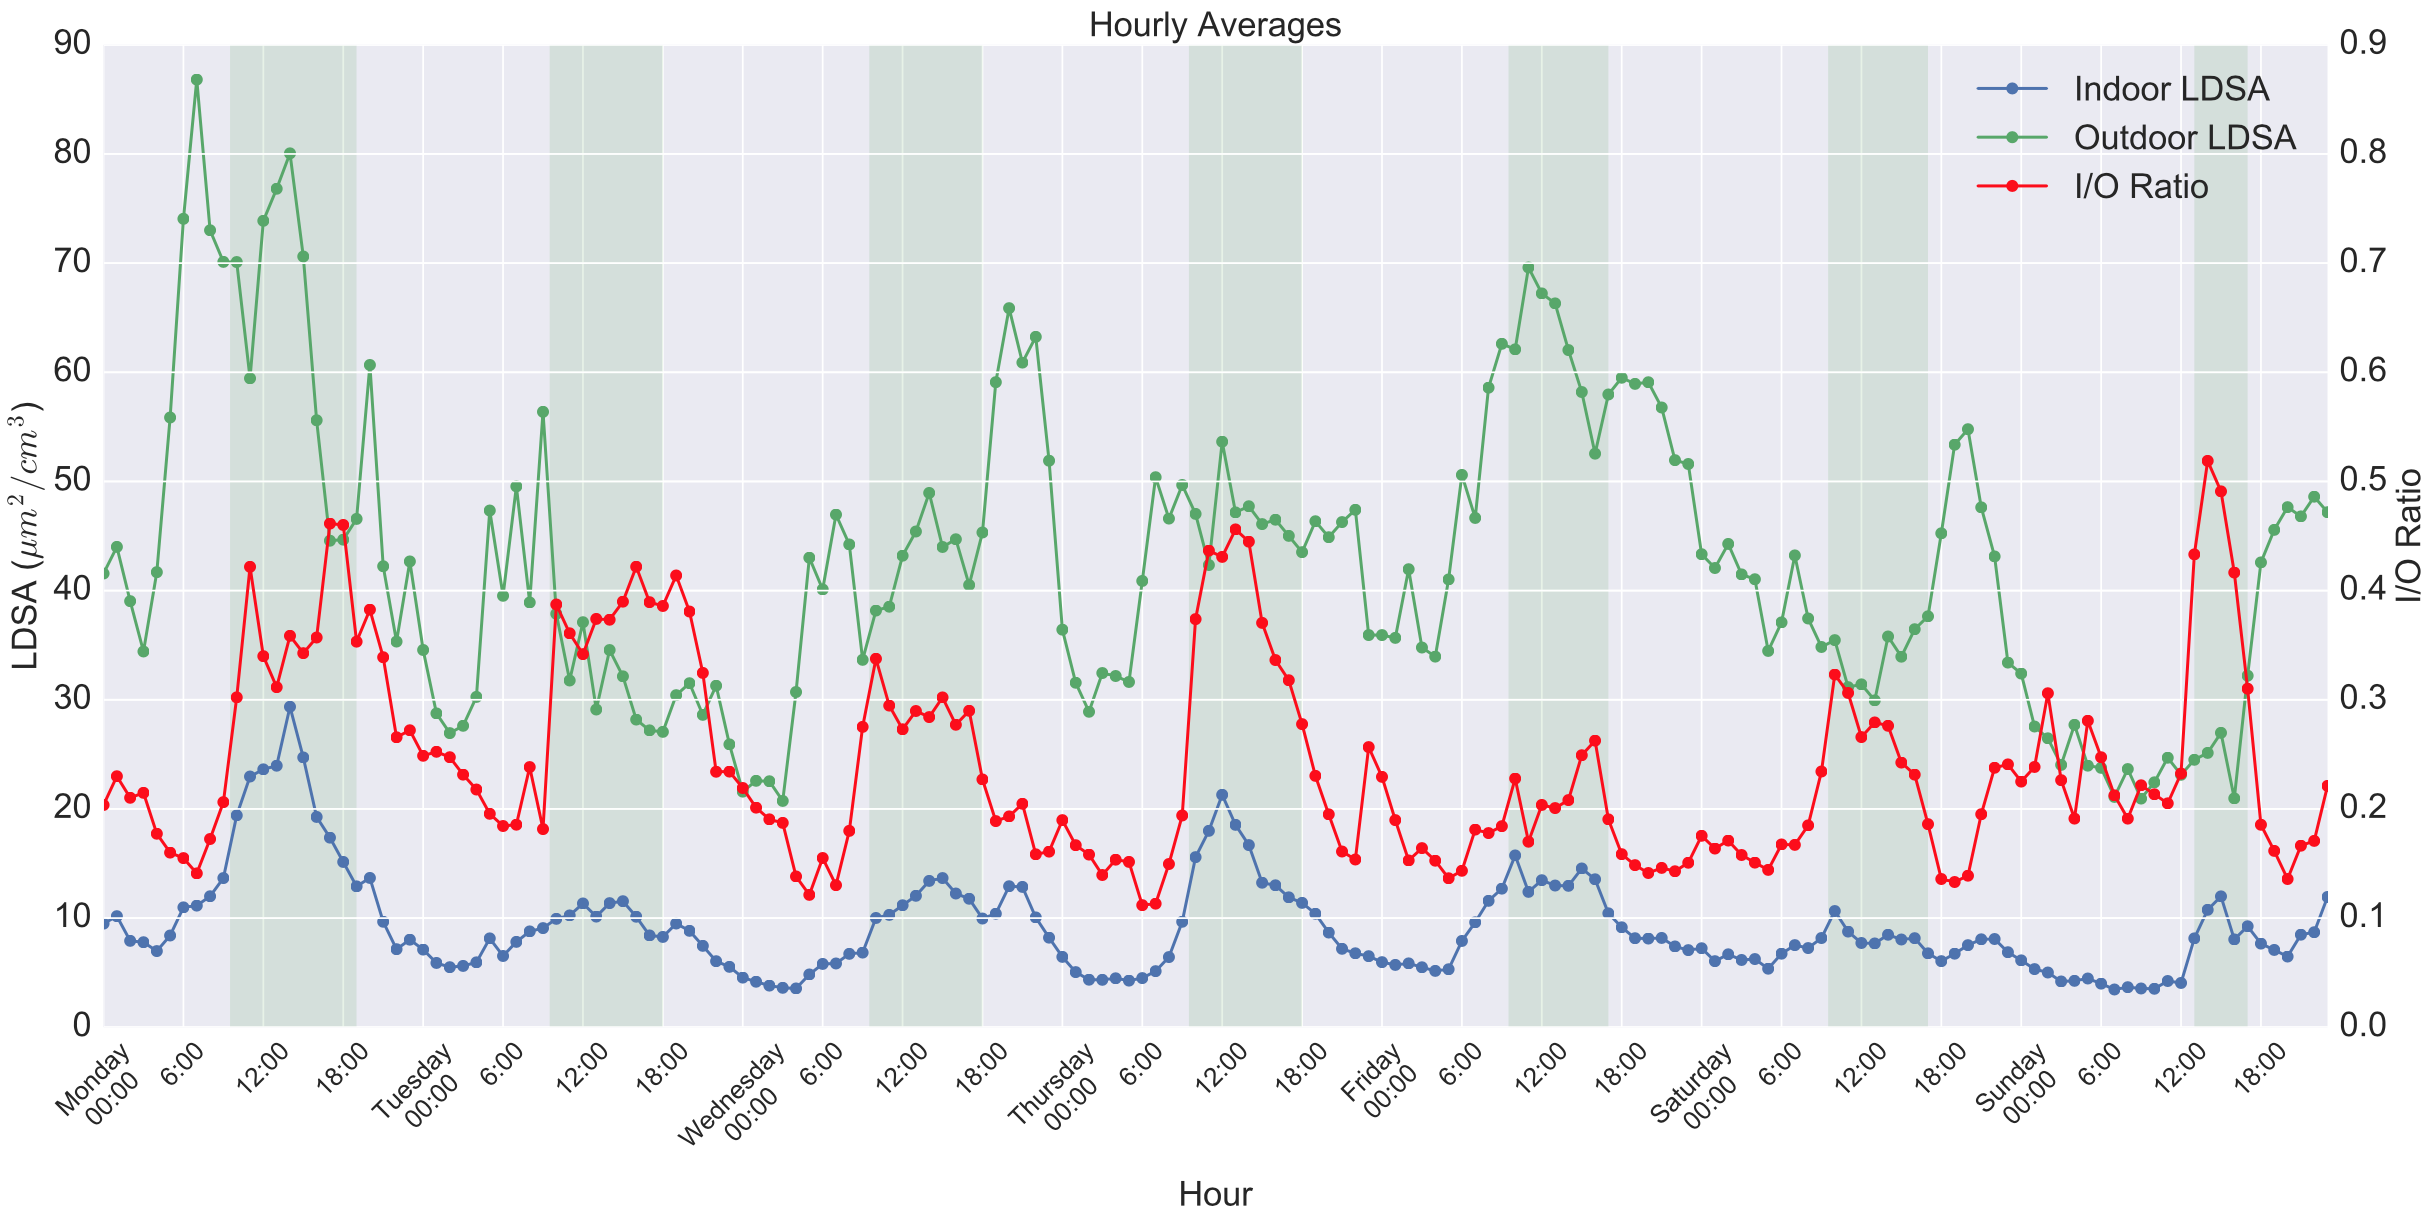 Figure 10. Time series of indoor (blue), outdoor (green), I/O (red) LDSA at FLPL. The Pegasor AQUrban unit PE-15 at the GWB toll plaza was compared with PE-14 on the roof of the library (fig. 11). The two devices yield a 0.85 correlation for PM2.5 (fig. 12). These data suggest that the indoor LDSA is largely influenced by traffic in and around Fort Lee, NJ. 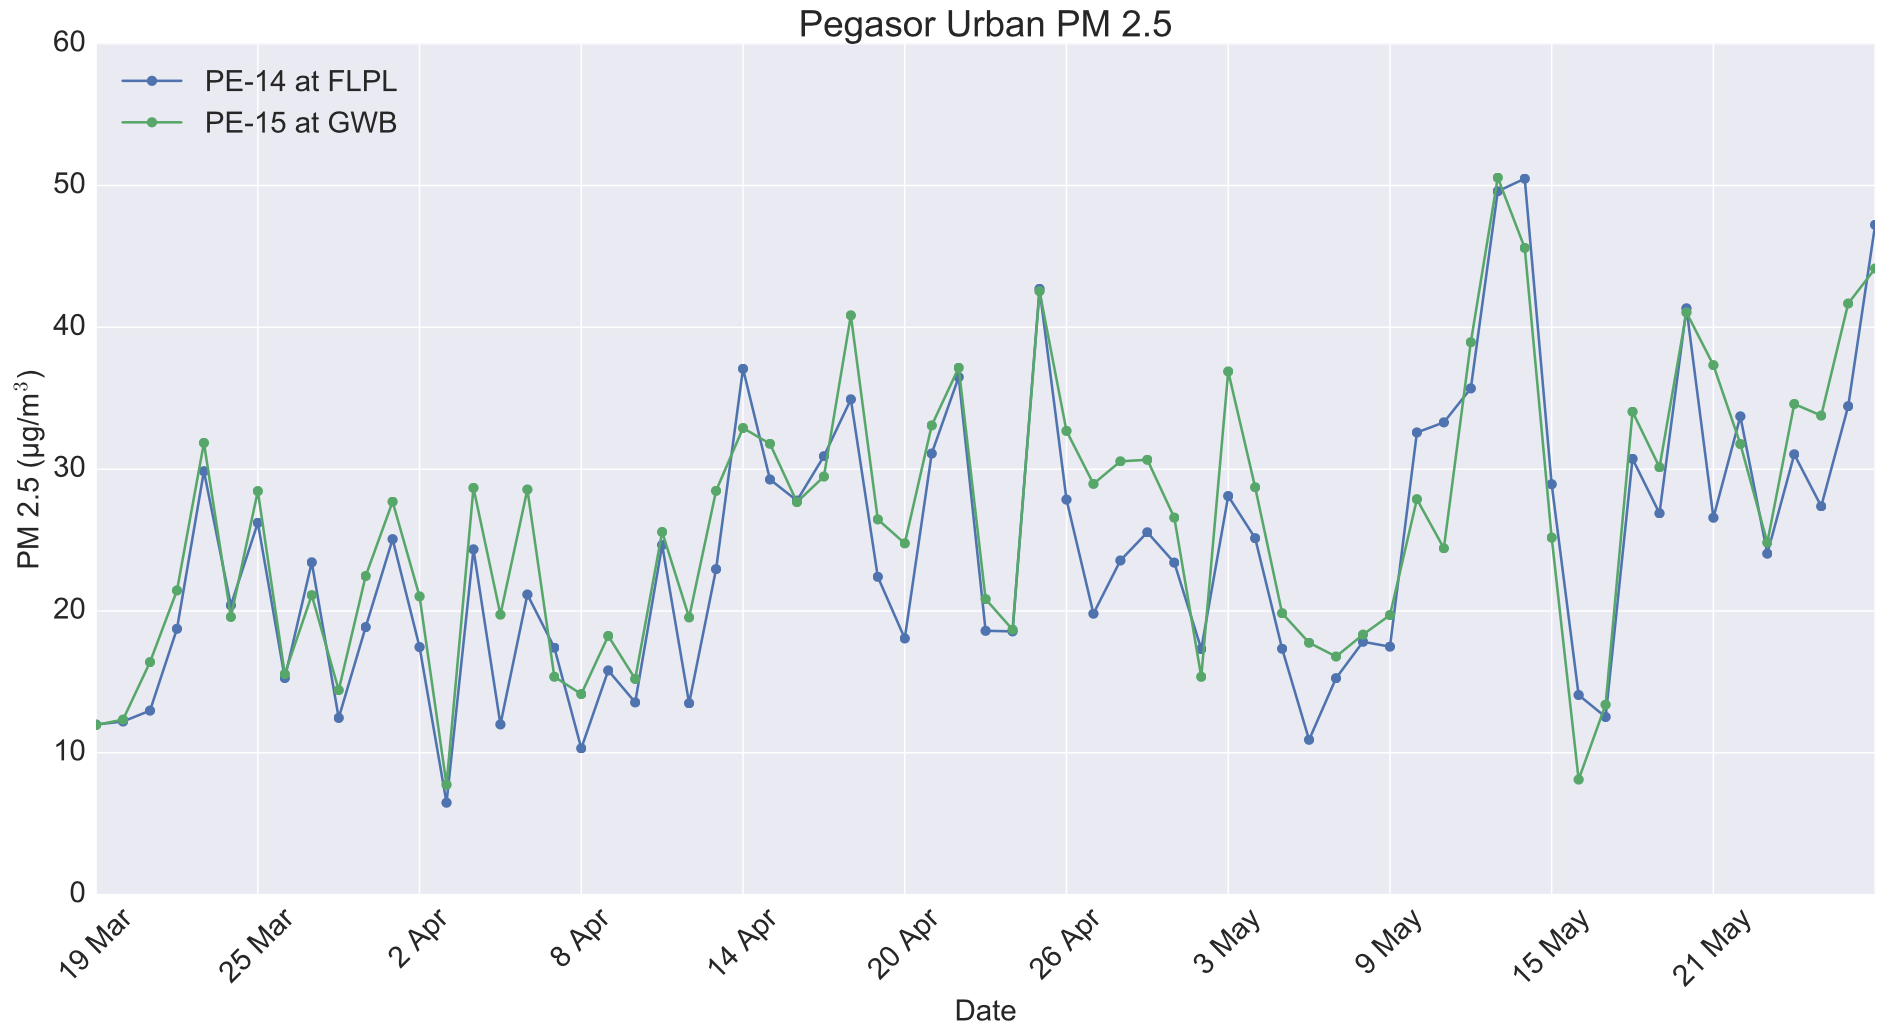 Figure 11. Time series of outdoor PM2.5 at FLPL (blue), and GWB (green). 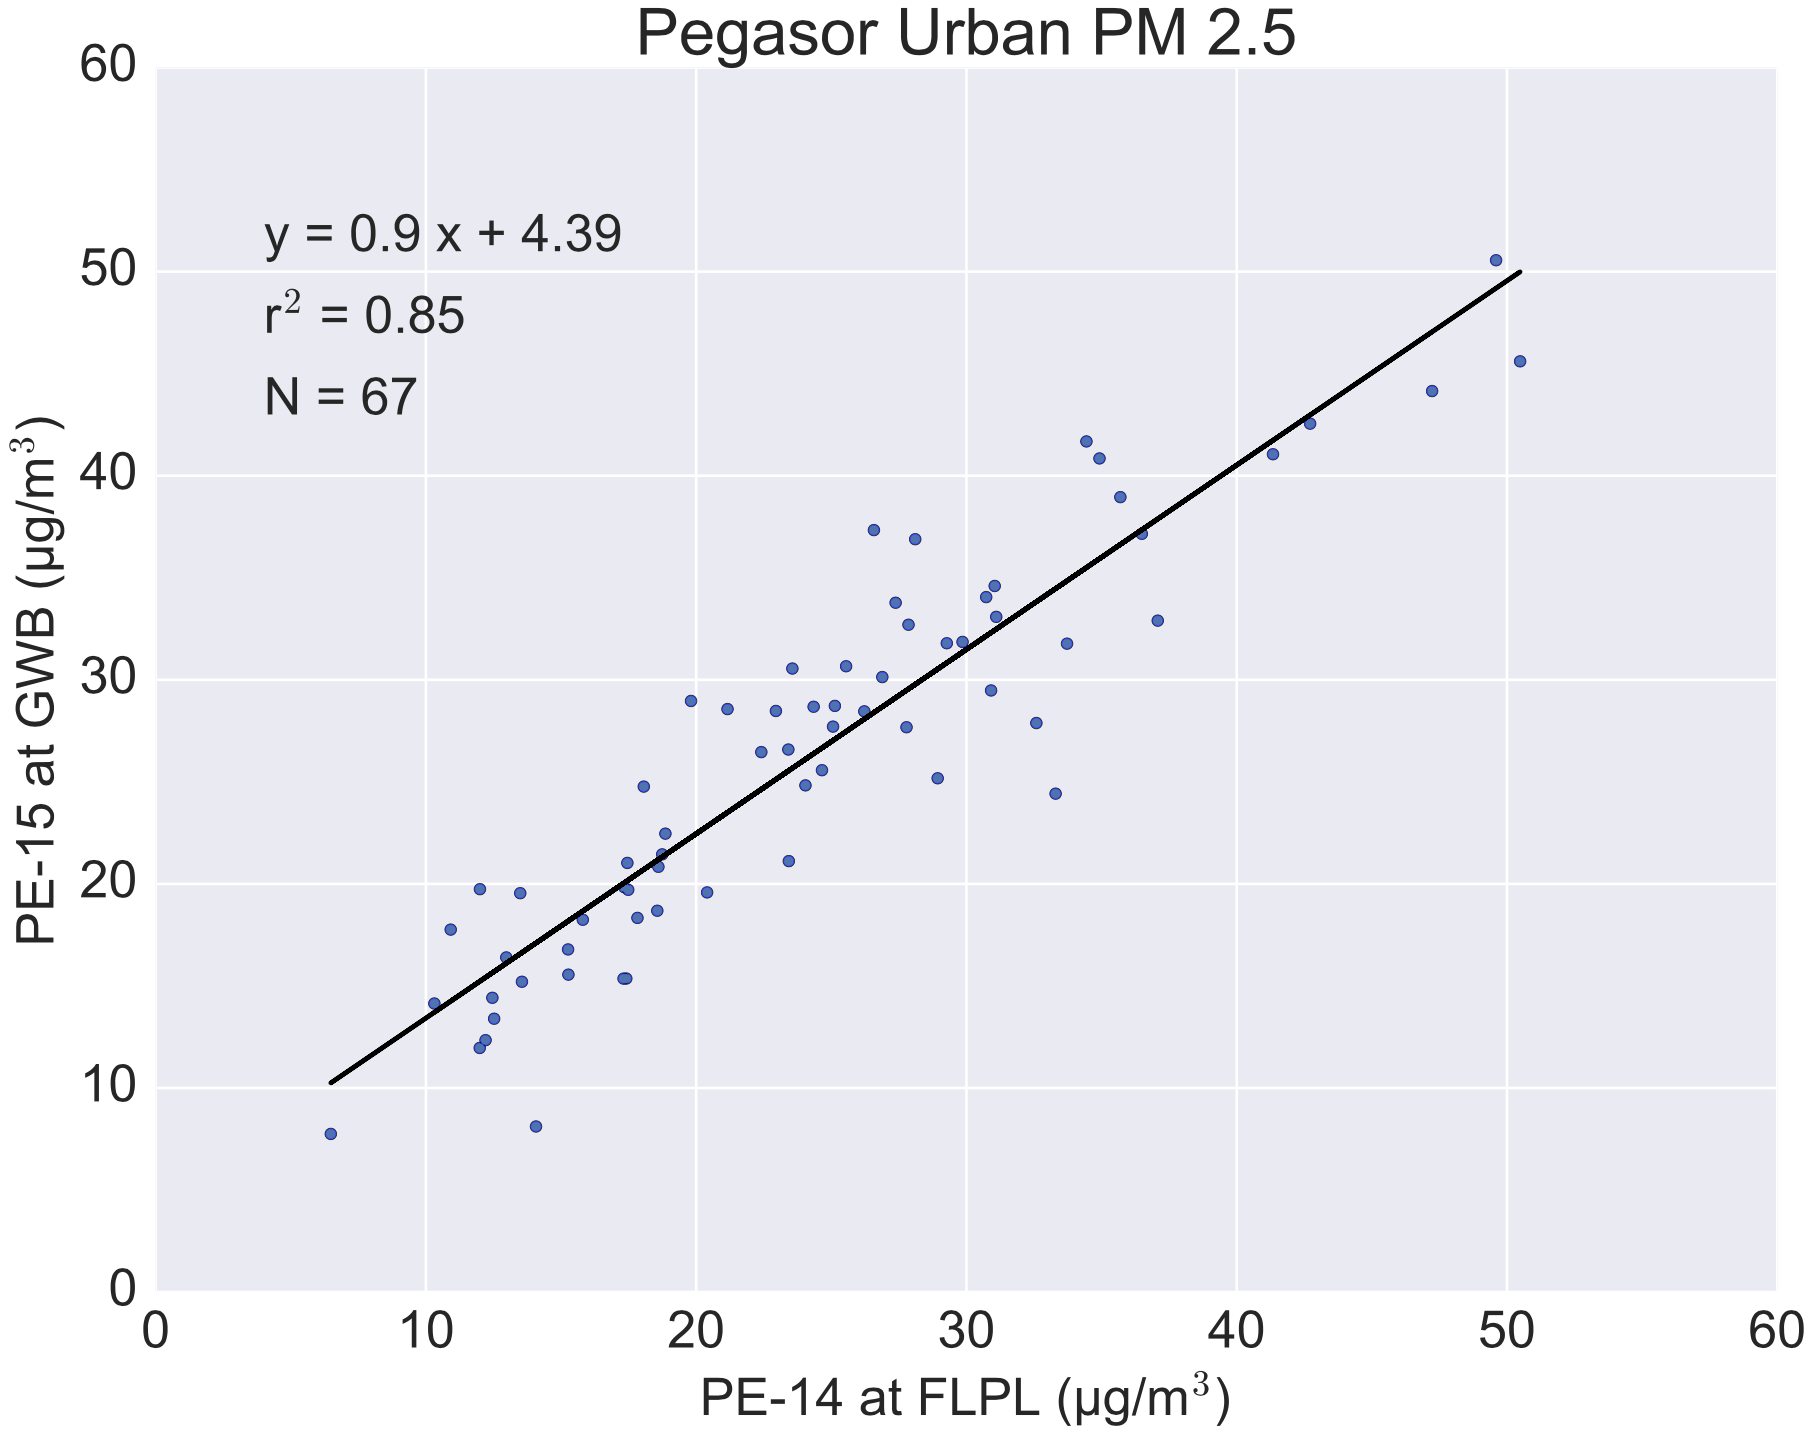 Figure 12. Outdoor PM2.5 correlation between FLPL (PE-14) and GWB (PE-15). CONCLUSIONS
REFERENCES [1] Underwood, E. The Polluted Brain. Science Magazine 355, 342–345 (2017). [2] Chen, C., & Zhao, B. (2011). Review of relationship between indoor and outdoor particles: I/O ratio, infiltration factor and penetration factor. Atmospheric Environment, 45, 275-288. [3] Kuuluvainen, H., Ronkko, T., Jarvinen, A., Saari, S., Karjalainen, P., Lahdeb, T., Pirjolab, L., Niemi, J. V., Hillamod, R., & Keskinen, J. (2016). Lung deposited surface area size distributions of particulate matter in different urban areas. Atmospheric Environment, 136, 105-113. |